USD/CAD Price Analysis: Corrects to 1.3730 ahead of US Retail Sales data
- USD/CAD falls modestly to 1.3730 after refreshing a five-month high near 1.3800.
- The US Dollar consolidates near 106.00 as the focus shifts to US Retail Sales data.
- Canada’s inflation data will influence speculation for BoC rate cuts.

The USD/CAD pair drops to 1.3730 in Monday’s European session. The Loonie asset falls while the US Dollar consolidates in a tight range, indicating some strength in the Canadian Dollar. The US Dollar Index (DXY) trades sideways in a range near a six-month high around 106.00.
The near-term demand for the Loonie asset remains strong as the Federal Reserve (Fed) is expected to keep interest rates restrictive for a longer period. Fed policymakers see no urgency for rate cuts as the consumer price inflation is persistently higher.
Meanwhile, investors await the United States Retail Sales data for March, which will impact speculation for Fed rate cuts. The monthly Retail Sales are estimated to have grown at a slower pace of 0.3% against the prior reading of 0.6%. An upbeat Retail Sales data will strengthen the inflation outlook that could negatively influence market expectations to Fed rate cuts, which are currently anticipated in the September meeting.
Going forward, the Canadian Dollar will dance to the tunes of Consumer Price Index (CPI) data for March, which will be published on Tuesday. The inflation data will provide cues about when the Bank of Canada (BoC) could begin reducing interest rates.
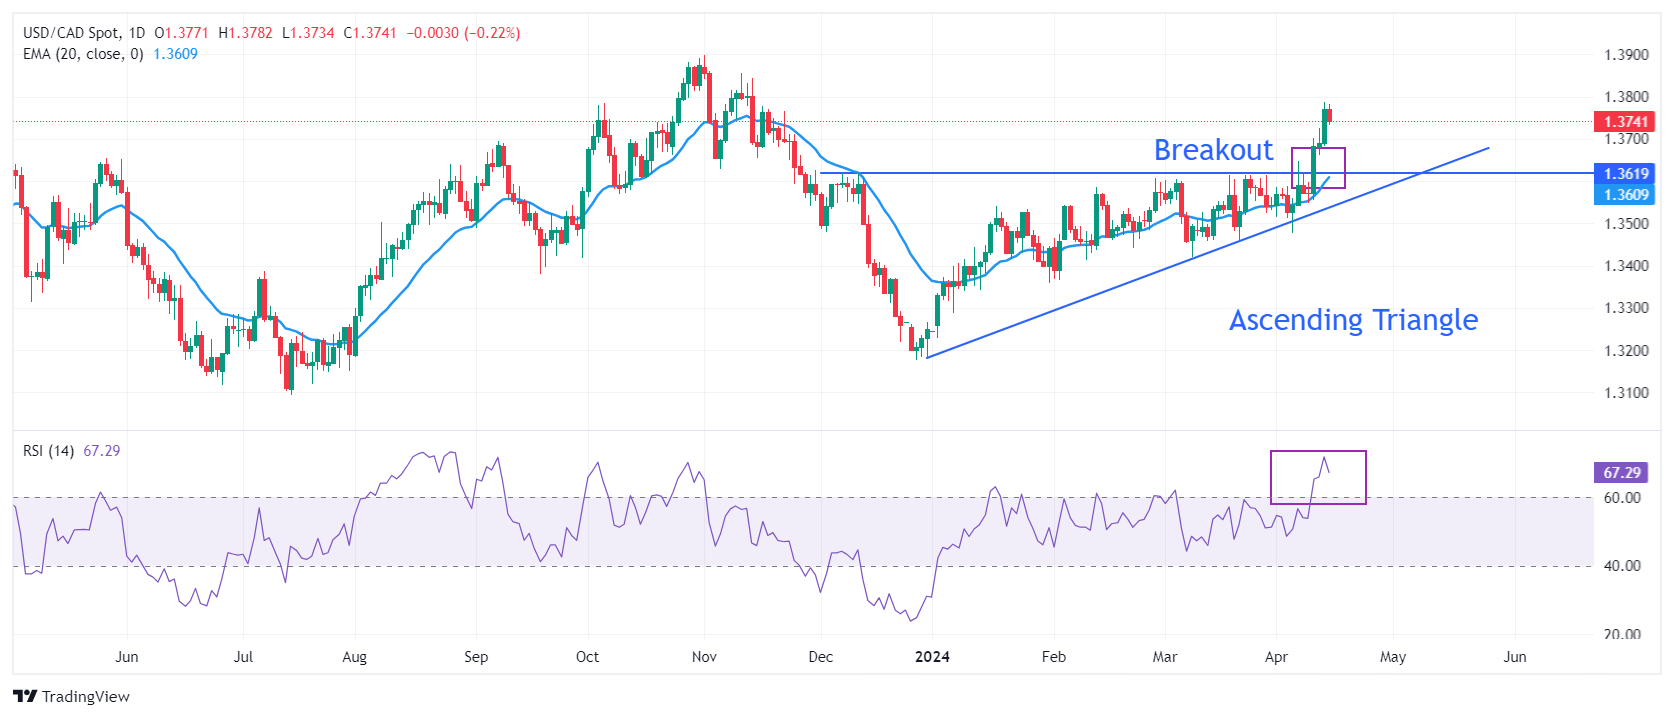
USD/CAD delivers a stalwart rally after a breakout of the Ascending Triangle chart pattern formed on a daily timeframe. An ascending triangle formation demonstrates a sharp volatility contraction that exhibits small ticks and low volume. While a breakout in the same results in wider ticks towards the upside and heavy buying volume.
Upward-sloping 20-day Exponential Moving Average (EMA) near 1.3610 indicates more upside ahead.
The 14-period Relative Strength Index (RSI) shifts into the bullish range of 60.00-80.00, signalling a bullish momentum has been triggered.
The Loonie asset would observe a fresh upside if it breaks above April 12 high at 1.3787. This will drive the asset towards November 4 high at 1.3844, followed by November high at 1.3900.
On the contrary, a downside move below April 9 low at 1.3547 would expose the asset to the psychological support of 1.3500. A breakdown below the latter would extend downside towards February 22 low at 1.3441.
(This story was corrected on April 15 at 11:25 GMT to say that the November high was at 1.3900, not at 1.900).
USD/CAD daily chart
(This story was corrected on April 15 at 12:50 GMT to say that the November high was at 1.3900, not at 1.900).
Author

Sagar Dua
FXStreet
Sagar Dua is associated with the financial markets from his college days. Along with pursuing post-graduation in Commerce in 2014, he started his markets training with chart analysis.