|

USD/CAD Price Analysis: Backs down to 50-day SMA after Triangle breakout

  • USD/CAD pulls back to support at the 50-day SMA.
  • It is possible it could begin a recovery from this level. 
  • At the same time a break lower could turn the tables on bulls. 

USD/CAD has continued pulling back after decisively breaking out of a Symmetrical Triangle (ST) pattern on the daily chart. The drip decline since the bullish upthrust on June 7 has taken price back down to the level of the 50-day Simple Moving Average (SMA) at 1.3696, and the upper trendline of the ST. 

USD/CAD Daily Chart

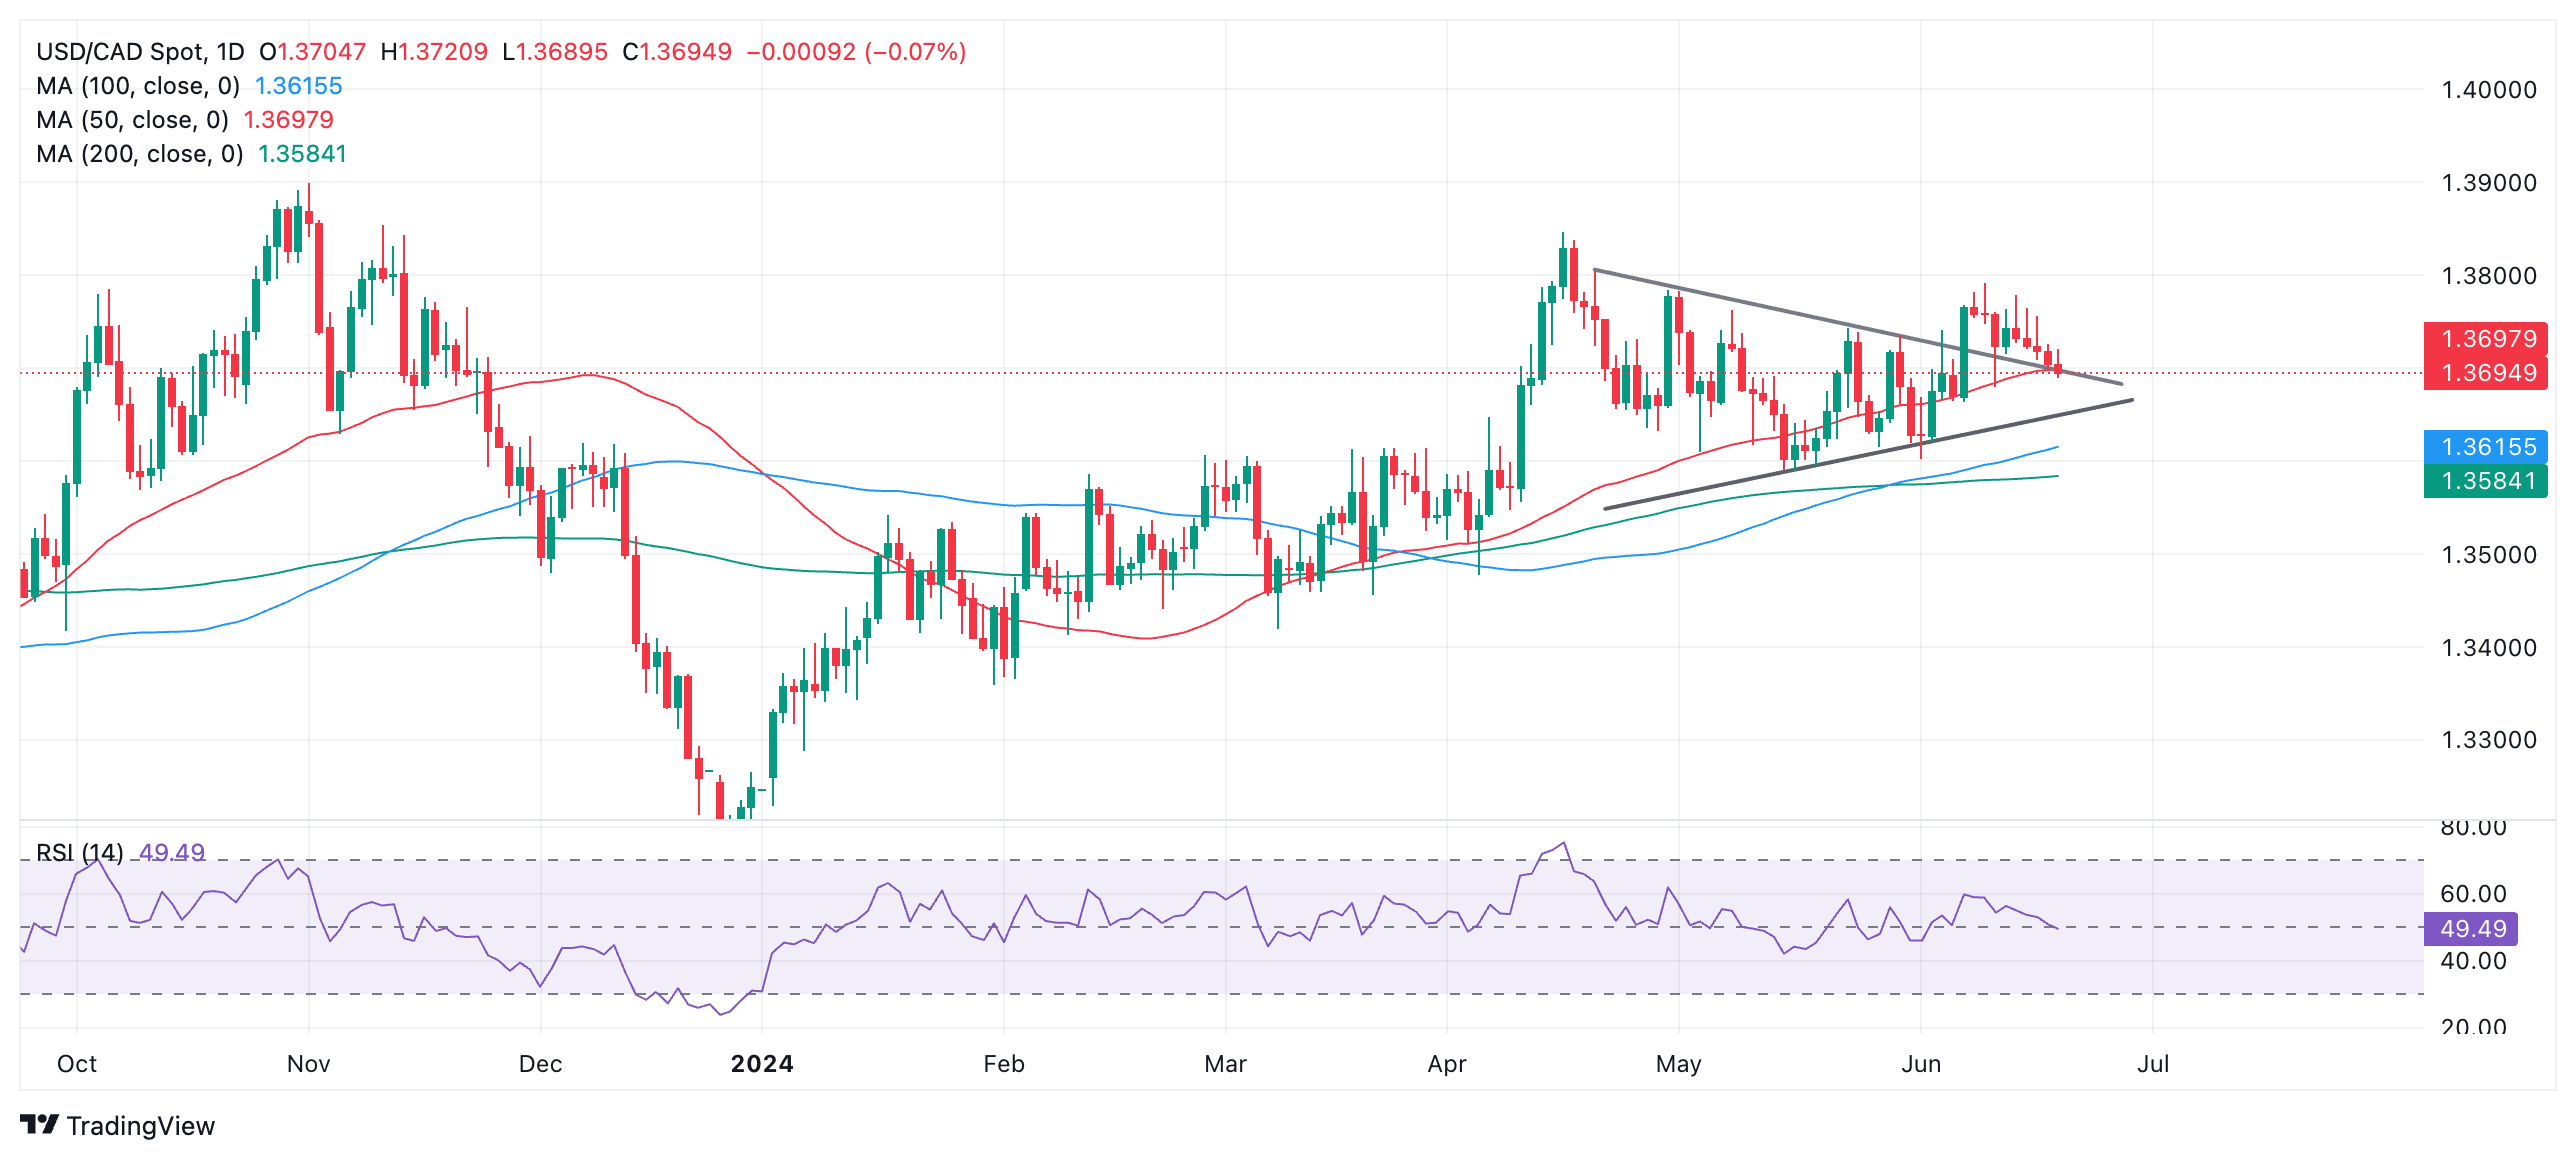
USD/CAD will probably find support at the 50-day SMA and upper borderline and, if so, it is possible this could mark the beginning of a recovery. 

The original breakout of the Symmetrical Triangle on June 7, activated some bullish upside targets for the pattern. The conservative target lies at roughly 1.3881, which is the 0.618 Fibonacci extrapolation of the height of the ST at its widest from the breakout point higher. 

A more bullish target lies at 1.3978, the 100% extrapolation of the height of the ST northwards. 

Although price action has been bearish since the June 7 breakout, with seven out of the last eight days closing lower, the odds continue to favor a resumption of the initial move higher. A break above 1.3791 (June 11 high) would provide bullish confirmation. 

However, a break below 1.3663 (June 7 low) would bring into doubt the uptrending bias. 

Furthemore, a break below the lower trendline of the ST at roughly 1.3640 would suggest a reversal lower, with such a move expected to reach a target at roughly 1.3518, the Fibonacci 0.618 ratio of the height of the Symmetrical Triangle pattern extrapolated lower.

Author

Joaquin Monfort

Joaquin Monfort is a financial writer and analyst with over 10 years experience writing about financial markets and alt data. He holds a degree in Anthropology from London University and a Diploma in Technical analysis.

More from Joaquin Monfort
Share:

Markets move fast. We move first.

Orange Juice Newsletter brings you expert driven insights - not headlines. Every day on your inbox.

By subscribing you agree to our Terms and conditions.

Editor's Picks

EUR/USD holds around 1.1750 after weak German and EU PMI data

EUR/USD maintains its range trade at around 1.1750 in European trading on Tuesday. Weaker-than-expected December PMI data from Germany and the Eurozone make it difficult for the Euro to find demand, while investors refrain from taking large USD positions ahead of key employment data.

GBP/USD climbs above 1.3400 after upbeat UK PMI data

GBP/USD gains traction and trades in positive territory above 1.3400 on Tuesday as the British Pound benefits from upbeat PMI data. Later in the day, crucial data releases from the US, including Nonfarm Payrolls, Retail Sales and PMI, could trigger the next big action in the pair.

Gold retreats from seven week highs on profit-taking; all eyes on US NFP release

Gold price loses momentum below $4,300 during the early European trading hours on Tuesday, pressured by some profit-taking and weak long liquidation from the shorter-term futures traders. Furthermore, optimism around Ukraine peace talks could weigh on the safe-haven asset like Gold.

US Nonfarm Payrolls expected to point to cooling labor market in November

The United States Bureau of Labor Statistics will release the delayed Nonfarm Payrolls (NFP) data for October and November on Tuesday at 13:30 GMT. Economists expect Nonfarm Payrolls to rise by 40,000 in November. The Unemployment Rate is likely to remain unchanged at 4.4% during the same period.

NFP preview: Complex data release will determine if Fed was right to cut rates

The long wait is over, and the Bureau of Labor Statistics in the US will release nonfarm payrolls reports for both November and October at 1330 GMT on Tuesday. The overall NFP figure for October is expected to be -10k, however, it is expected to be influenced by a massive 130k drop in federal department workers. 

BNB Price Forecast: BNB slips below $855 as bearish on-chain signals and momentum indicators turn negative

BNB, formerly known as Binance Coin, continues to trade down around $855 at the time of writing on Tuesday, after a slight decline the previous day. Bearish sentiment further strengthens as BNB’s on-chain and derivatives data show rising retail activity.