USD/CAD Price Analysis: At make or a break around 1.3500


  • USD/CAD falls to 1.3500 due to multiple headwinds.
  • The US Dollar corrects further on the weak US ISM Services PMI report.
  • Higher Oil prices due to deepening supply concerns boosted the Canadian Dollar.

The USD/CAD pair falls sharply to the psychological support of 1.3500 in the European session on Thursday. The Loonie asset faces an intense sell-off as the US Dollar weakens and global Oil prices remain broadly strong.

The US Dollar Index (DXY), which values the US Dollar against six major currencies, corrects to 104.00 as weak United States ISM Services PMI report for March casts doubts over economic resilience. 10-year US Treasury yields rose as Federal Reserve (Fed) policymakers demanded more data before considering rate cuts.

On Wednesday, Fed Chair Jerome Powell said in a speech, "Recent readings on both job gains and inflation have come in higher than expected," Powell maintained the baseline that rate cuts will start later this year only when policymakers "have greater confidence that inflation is moving sustainably down.

Meanwhile, higher global oil prices have strengthened the Canadian Dollar. West Texas Intermediate (WTI) futures on NYMEX are slightly down near $85.35 but have come higher significantly this week. The Oil price rose after Ukraine’s drone attacks on Russian oil refineries deepened supply concerns. It is worth noting that Canada is the leading exporter of oil to the United States, and higher Oil prices strengthen the Canadian Dollar.

Going forward, the US Dollar and the Canadian Dollar will be guided by the Employment data from their respective economies, which will be published on Friday.

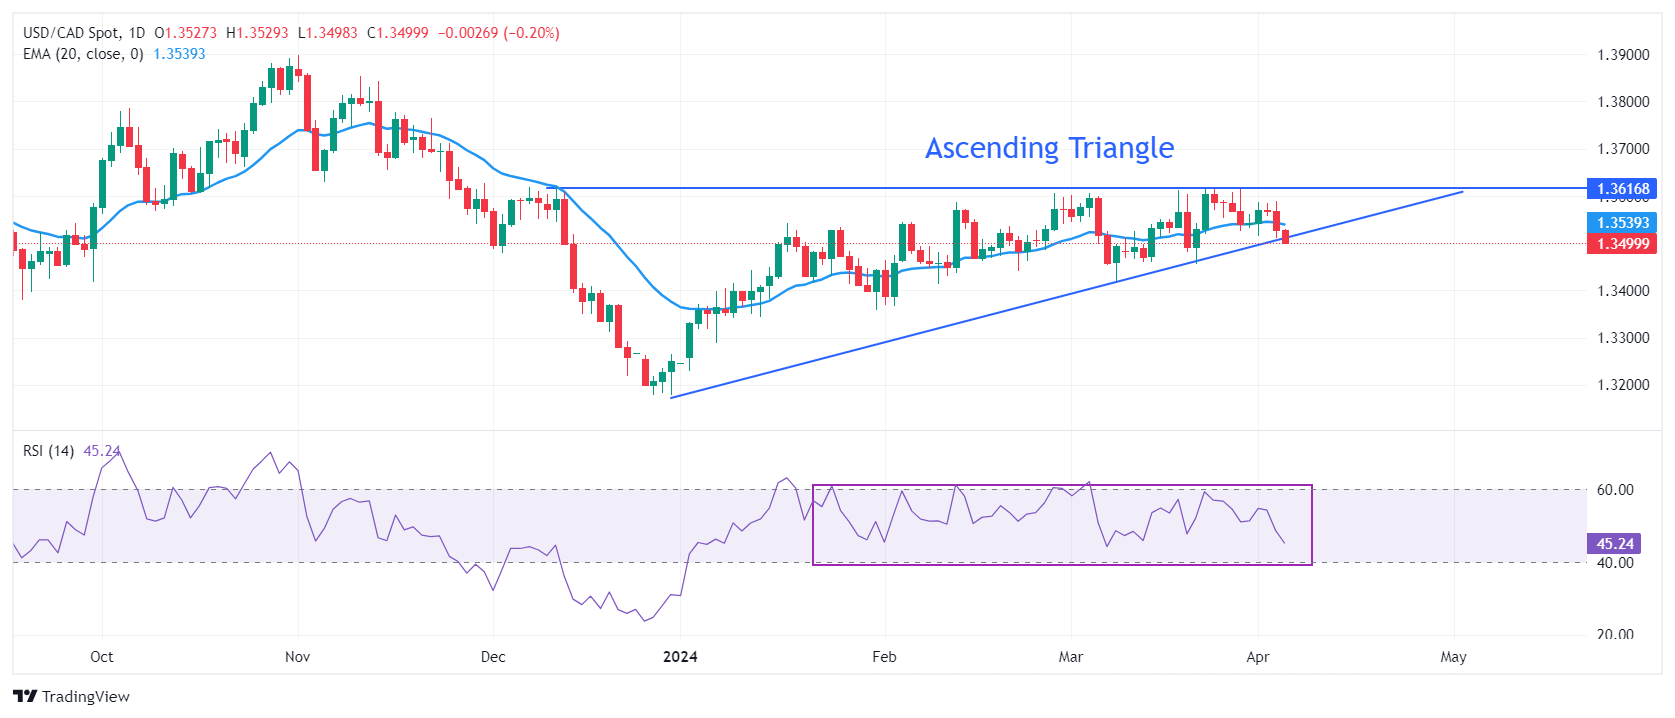
USD/CAD seems close to exploding the Ascending Triangle pattern formed on a daily time. The upward-sloping border of the aforementioned pattern is placed from December 27 low at 1.3177 while horizontal resistance is plotted from December 7 high at 1.3620. The chart pattern exhibits a sharp volatility contraction and a breakout can happen in any direction.

The asset drops below the 20-day Exponential Moving Average (EMA) near 1.3520, suggesting that the near-term appeal is weak.

The 14-period Relative Strength Index (RSI) oscillates inside the 40.00-60.00 range, indicating indecisiveness among investors.

A downside move below February 22 low at 1.3441 would expose the asset to February 9 low at 1.3413. A breakdown below the latter would extend downside towards January 15 low at 1.3382.

On the flip side, the Loonie asset would observe a fresh upside if it breaks above December 7 high at 1.3620. This will drive the asset towards May 26 high at 1.3655, followed by the round-level resistance of 1.3700.

USD/CAD daily chart

USD/CAD

Overview
Today last price 1.35
Today Daily Change -0.0027
Today Daily Change % -0.20
Today daily open 1.3527
 
Trends
Daily SMA20 1.3534
Daily SMA50 1.3511
Daily SMA100 1.3489
Daily SMA200 1.3502
 
Levels
Previous Daily High 1.3589
Previous Daily Low 1.3512
Previous Weekly High 1.3614
Previous Weekly Low 1.3525
Previous Monthly High 1.3614
Previous Monthly Low 1.342
Daily Fibonacci 38.2% 1.3541
Daily Fibonacci 61.8% 1.356
Daily Pivot Point S1 1.3496
Daily Pivot Point S2 1.3465
Daily Pivot Point S3 1.3418
Daily Pivot Point R1 1.3573
Daily Pivot Point R2 1.362
Daily Pivot Point R3 1.3651


Share: Feed news

Information on these pages contains forward-looking statements that involve risks and uncertainties. Markets and instruments profiled on this page are for informational purposes only and should not in any way come across as a recommendation to buy or sell in these assets. You should do your own thorough research before making any investment decisions. FXStreet does not in any way guarantee that this information is free from mistakes, errors, or material misstatements. It also does not guarantee that this information is of a timely nature. Investing in Open Markets involves a great deal of risk, including the loss of all or a portion of your investment, as well as emotional distress. All risks, losses and costs associated with investing, including total loss of principal, are your responsibility. The views and opinions expressed in this article are those of the authors and do not necessarily reflect the official policy or position of FXStreet nor its advertisers. The author will not be held responsible for information that is found at the end of links posted on this page.

If not otherwise explicitly mentioned in the body of the article, at the time of writing, the author has no position in any stock mentioned in this article and no business relationship with any company mentioned. The author has not received compensation for writing this article, other than from FXStreet.

FXStreet and the author do not provide personalized recommendations. The author makes no representations as to the accuracy, completeness, or suitability of this information. FXStreet and the author will not be liable for any errors, omissions or any losses, injuries or damages arising from this information and its display or use. Errors and omissions excepted.

The author and FXStreet are not registered investment advisors and nothing in this article is intended to be investment advice.

Recommended content


Recommended content

Editors’ Picks

EUR/USD under pressure near 1.0350 after mixed sentiment data

EUR/USD under pressure near 1.0350 after mixed sentiment data

EUR/USD remains in the negative territory near 1.0350 in the European session on Tuesday, erasing a portion of Monday's gains. The pair is undermined by risk aversion and the US Dollar demand, fuelled by US President Trump's tariff threats, and mixed sentiment data.

EUR/USD News
GBP/USD drops to 1.2250 area on broad USD strength

GBP/USD drops to 1.2250 area on broad USD strength

GBP/USD stays under bearish pressure and trades deep in the red near 1.2250 on Tuesday as the USD gathers strength following US President Trump's tariff threats. The data from the UK showed that the ILO Unemployment Rate edged higher to 4.4% in the three months to November.

GBP/USD News
Gold price eases from over two-month top on stronger USD, positive risk tone

Gold price eases from over two-month top on stronger USD, positive risk tone

Gold price (XAU/USD) retreats slightly after touching its highest level since November 6 during the early European session on Tuesday and currently trades just below the $2,725 area, still up over 0.50% for the day.

Gold News
Bitcoin fails to sustain the $109K mark after Trump’s inauguration

Bitcoin fails to sustain the $109K mark after Trump’s inauguration

Bitcoin’s price steadies above the $102,000 mark on Tuesday after reaching a new all-time high of $109,588 the previous day. Santiment’s data shows that BTC prices quickly corrected, as social media showed major greed and FOMO among the traders in Bitcoin after President Donald Trump’s inauguration.

Read more
Five keys to trading Trump 2.0 with Gold, Stocks and the US Dollar

Five keys to trading Trump 2.0 with Gold, Stocks and the US Dollar Premium

"I have the best words" – one of Donald Trump's famous quotes represents one of the most significant shifts to trading during his time. Words from the president may have a more significant impact than economic data.

Read more
Trusted Broker Reviews for Smarter Trading

Trusted Broker Reviews for Smarter Trading

VERIFIED Discover in-depth reviews of reliable brokers. Compare features like spreads, leverage, and platforms. Find the perfect fit for your trading style, from CFDs to Forex pairs like EUR/USD and Gold.

Read More

Forex MAJORS

Cryptocurrencies

Signatures