Breaking: US S&P Global Manufacturing PMI surprised to the upside in May

The US S&P Global Composite PMI improved to 54.4 in May's flash estimate, up from 51.3, indicating that business activity in the US private sector continued to grow at a faster pace than in April.
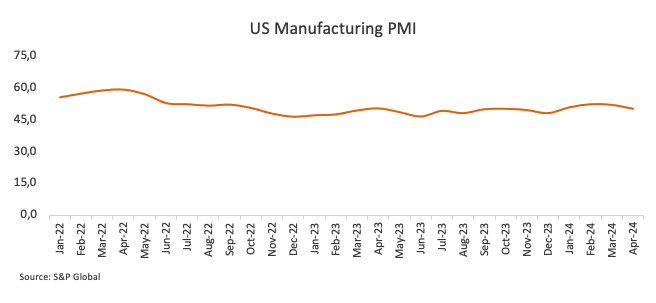
Meanwhile, the S&P Global Manufacturing PMI increased to 50.9 from 50.0 over the same period, signalling an expansion in the manufacturing sector. Additionally, the S&P Global Services PMI rose to 54.8 from 51.3.
In the news release: "US business activity growth accelerated sharply to its fastest for just over two years in May, according to provisional PMI survey data from S&P Global, signalling an improved economic performance midway through the second quarter. The service sector led the upturn, reporting the largest output rise for a year, but manufacturing also showed stronger growth."
Furthermore, Chris Williamson, Chief Business Economist at S&P Global Market Intelligence said: “The US economic upturn has accelerated again after two months of slower growth, with the early PMI data signalling the fastest expansion for just over two years in May. The data put the US economy back on course for another solid GDP gain in the second quarter.
Market reaction
The US Dollar Index (DXY) trims almost all of its earlier losses in the wake of the better-than-expected US S&P Global PMIs, re-shifting its target to another potential visit to the 105.00 region on Thursday.
US Dollar PRICE Today
The table below shows the percentage change of US Dollar (USD) against listed major currencies today. US Dollar was the strongest against the Japanese Yen.
| USD | EUR | GBP | JPY | CAD | AUD | NZD | CHF | |
|---|---|---|---|---|---|---|---|---|
| USD | -0.11% | 0.06% | 0.17% | -0.08% | -0.10% | -0.20% | -0.10% | |
| EUR | 0.11% | 0.16% | 0.29% | 0.03% | 0.00% | -0.10% | 0.01% | |
| GBP | -0.06% | -0.16% | 0.14% | -0.15% | -0.17% | -0.26% | -0.15% | |
| JPY | -0.17% | -0.29% | -0.14% | -0.27% | -0.29% | -0.44% | -0.28% | |
| CAD | 0.08% | -0.03% | 0.15% | 0.27% | -0.02% | -0.11% | -0.03% | |
| AUD | 0.10% | -0.00% | 0.17% | 0.29% | 0.02% | -0.08% | -0.01% | |
| NZD | 0.20% | 0.10% | 0.26% | 0.44% | 0.11% | 0.08% | 0.10% | |
| CHF | 0.10% | -0.01% | 0.15% | 0.28% | 0.03% | 0.01% | -0.10% |
The heat map shows percentage changes of major currencies against each other. The base currency is picked from the left column, while the quote currency is picked from the top row. For example, if you pick the US Dollar from the left column and move along the horizontal line to the Japanese Yen, the percentage change displayed in the box will represent USD (base)/JPY (quote).
This section below was published at 08:00 GMT as a preview of the US S&P Global PMI data.
- S&P Global PMIs are expected to indicate some loss of momentum in US economic activity in May.
- Manufacturing and Services prints are seen almost unchanged this month.
- EUR/USD remains on the back foot so far this week.
On Thursday, S&P Global will issue its flash estimates of the United States (US) Purchasing Managers Indexes (PMIs), a monthly survey of business activity. The survey is separated into services and manufacturing output and aggregated into a single statistic, the Composite PMI.
In April, economic activity in the US private sector contracted somewhat, with the S&P Global Composite PMI easing to 51.3, following a drop in manufacturing output to 50, while the services index slipped back to 51.3. All components, however, remained above the 50 threshold, the border between expansion and contraction.
From the press release: “Manufacturing production increased for the third consecutive month, albeit at the slowest pace in this sequence. With new orders down, output was often supported by work on previously received orders.”
With the US economy showing tepid signs of deceleration and the labour market cooling somewhat, market participants have been pencilling in the likelihood that the US Federal Reserve (Fed) might start reducing its Fed Funds Target Range (FFTR) in the next few months. However, sticky inflation continues to prompt caution regarding the potential timing of the commencement of the Fed’s easing programme, a view that has been further propped up by the equally prudent stance of many policymakers.
What can we expect from the next S&P Global PMI report?
The May S&P Global Manufacturing PMI is expected to be 50.0, unchanged from April’s figure, but still within the expansionary territory (>50). A similar outcome is forecast in terms of services production, with the index expected to print at 51.3, matching the previous month’s reading.
As long as the measurements are over 50.0, the impact of a decline should be minimal. However, a drop below the line that divides expansion and contraction might reinforce speculation about Fed rate reductions, most likely to begin at the September 18 meeting. Such a scenario could likely maintain the US Dollar (USD) under pressure, forcing the USD Index (DXY) to give away part of the weekly advance.
The opposite scenario, that is, a positive surprise, should underpin the Fed’s tighter-for-longer narrative, supporting a stronger Dollar and higher yields across the curve.
When will May flash US S&P Global PMIs be released and how could they affect EUR/USD?
The S&P Global PMI report will be issued on Thursday, May 23, at 13:45 GMT. So far, EUR/USD has been suffering the recovery in the Greenback and revisited the low-1.0800s after hitting fresh monthly peaks in levels just shy of 1.0900 the figure earlier in the month.
From the technical viewpoint, FXStreet’s Senior Analyst Pablo Piovano argues: “EUR/USD faces its initial up-barrier at the May peak of 1.0894 (May 6). The surpass of this region could prompt spot to embark on a potential visit to the March high of 1.0981 (March 8) seconded by the weekly top of 1.0998 (January 5, 2011), all followed by the psychological 1.1000 yardstick.”
Pablo adds: “On the downside, a sustainable breach of the key 200-day SMA at 1.0787 should shift the near-term outlook to bearish, allowing extra weakness to potentially retest the May low of 1.0649 (May 1) ahead of the 2024 bottom of 1.0601 (April 16).”
Economic Indicator
S&P Global Composite PMI
The S&P Global Composite Purchasing Managers Index (PMI), released on a monthly basis, is a leading indicator gauging US private-business activity in the manufacturing and services sector. The data is derived from surveys to senior executives. Each response is weighted according to the size of the company and its contribution to total manufacturing or services output accounted for by the sub-sector to which that company belongs. Survey responses reflect the change, if any, in the current month compared to the previous month and can anticipate changing trends in official data series such as Gross Domestic Product (GDP), industrial production, employment and inflation. The index varies between 0 and 100, with levels of 50.0 signaling no change over the previous month. A reading above 50 indicates that the private economy is generally expanding, a bullish sign for the US Dollar (USD). Meanwhile, a reading below 50 signals that activity is generally declining, which is seen as bearish for USD.
Read more.Last release: Fri May 03, 2024 13:45
Frequency: Monthly
Actual: 51.3
Consensus: 50.9
Previous: 50.9
Source: S&P Global
Author

Pablo Piovano
FXStreet
Born and bred in Argentina, Pablo has been carrying on with his passion for FX markets and trading since his first college years.


