US Dollar flat against pressure from weak industrial data from China and Japan
- The US Dollar trades stable in very calm holiday trading on Friday.
- Monthly Industrial Production in Japan fell by 2.3%, less than the expected 3.5%, while big Chinese manufacturers also reported falling profits.
- The US Dollar Index (DXY) briefly slipt below 108.00, remains close to a two-year high.

The US Dollar (USD) is trading a touch softer this Friday, with the DXY index unable to hold position above 108.00, as markets remain cautious and trading desks are short-staffed due to the Christmas holiday. The Dollar failed to react to more action in Asian markets, with data signaling further contraction in Japan’s Industrial Production and Chinese industrial companies reporting lower profits.
The US economic calendar is very light on Friday, with the preliminary Goods Trade Balance and the Wholesale Inventories data. Not much movement is expected from these data points. So a rather steady trading session is expected.
Daily digest market movers: Equity dip
- Both data points from the US for this Friday will be released:
- The November Goods Trade Balance saw a widening deficit of 102.9 billion USD against the previous 98.7 billion USD deficit and beating the 100.8 billion USD estimate.
- November Wholesale Inventories shrunk by 0.2% against the previous 0.2% and concensus estimate.
- Equities trade mixed on Friday, with all US equity futures are trading lower with the Nasdaq losing over 1%.
- The CME FedWatch Tool for the first Fed meeting of 2025 on January 29 sees an 89.3% chance for a stable policy rate against a small 10.7% chance for a 25 basis points rate cut.
- The US 10-year benchmark rate trades at 4.59%, not far from this week’s high at 4.64%.
US Dollar Index Technical Analysis: Nothing to see here for now
The US Dollar Index (DXY) is not expected to attack any firm levels this Friday given the low liquidity and only a handful of market participants present between Christmas and New Year. Any big movements aren’t expected unless an outside event takes place on the geopolitical front. It looks like the DXY will head into New Year’s Eve trading just above 108.00.
On the upside, a trend line originating from December 28, 2023, is acting as a moving cap. The next firm resistance comes in at 109.29, which was the peak of July 14, 2022, and has a good track record as a pivotal level. Once that level is surpassed, the 110.00 round level comes into play.
The first downside barrier comes in at 107.35, which has now turned from resistance into support. The second level that might be able to halt any selling pressure is 106.52. From there, even 105.53 could come under consideration while the 55-day Simple Moving Average (SMA) at 105.83 is making its way up to that level.
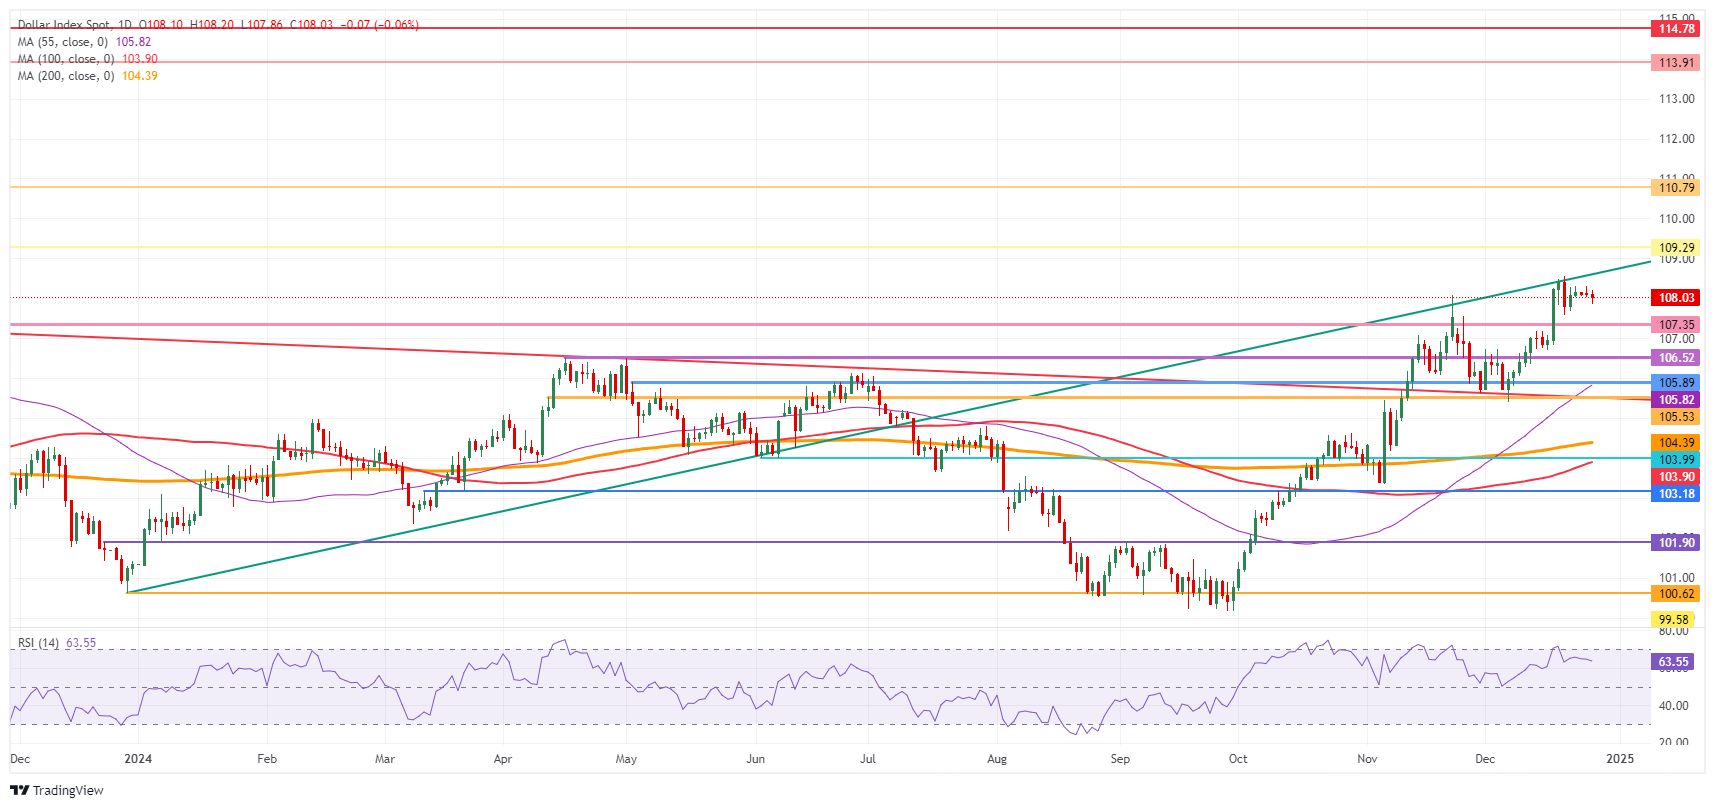
US Dollar Index: Daily Chart
Inflation FAQs
Inflation measures the rise in the price of a representative basket of goods and services. Headline inflation is usually expressed as a percentage change on a month-on-month (MoM) and year-on-year (YoY) basis. Core inflation excludes more volatile elements such as food and fuel which can fluctuate because of geopolitical and seasonal factors. Core inflation is the figure economists focus on and is the level targeted by central banks, which are mandated to keep inflation at a manageable level, usually around 2%.
The Consumer Price Index (CPI) measures the change in prices of a basket of goods and services over a period of time. It is usually expressed as a percentage change on a month-on-month (MoM) and year-on-year (YoY) basis. Core CPI is the figure targeted by central banks as it excludes volatile food and fuel inputs. When Core CPI rises above 2% it usually results in higher interest rates and vice versa when it falls below 2%. Since higher interest rates are positive for a currency, higher inflation usually results in a stronger currency. The opposite is true when inflation falls.
Although it may seem counter-intuitive, high inflation in a country pushes up the value of its currency and vice versa for lower inflation. This is because the central bank will normally raise interest rates to combat the higher inflation, which attract more global capital inflows from investors looking for a lucrative place to park their money.
Formerly, Gold was the asset investors turned to in times of high inflation because it preserved its value, and whilst investors will often still buy Gold for its safe-haven properties in times of extreme market turmoil, this is not the case most of the time. This is because when inflation is high, central banks will put up interest rates to combat it. Higher interest rates are negative for Gold because they increase the opportunity-cost of holding Gold vis-a-vis an interest-bearing asset or placing the money in a cash deposit account. On the flipside, lower inflation tends to be positive for Gold as it brings interest rates down, making the bright metal a more viable investment alternative.
Author

Filip Lagaart
FXStreet
Filip Lagaart is a former sales/trader with over 15 years of financial markets expertise under its belt.