US Dollar set to close off terrible week in terms of performance
- The US Dollar back in red numbers after PPI release.
- Markes see pressure building on President Biden with Obama issuing concerns.
- The US Dollar index falls back to the lower end at 104.00.
The US Dollar (USD) trades in the red on Friday at the US Opening bell, with markets selling the Greenback as a clear rotation is taking place in the equity markets. With an interest rate cut from the US Federal Reserve (Fed) being a near certainty in September, investors are shifting away from the big tech names and are heading into smaller stocks and blue chips that represent more niche sectors that should see demand pick up with more disposable income freed up once rates get cut. Meanwhile, concerns about US President Joe Biden increased after he called Russian President Vladimir Putin to Ukraine President Volodymyr Zelensky during a high-stakes NATO summit, which could mean the final straw for some of his financial donors.
On the economic front, the University of Michigan has released its numbers as well. A miss on Consumer Sentiment and a softer Inflation expectation are enough to deliver that final blow to the US Dollar Index (DXY). The Producer Price Index (PPI) for June earlier this Friday was a bit of a letdown with surprise upticks on all components and revisions.
Daily digest market movers: Softer all around
- US President Joe Biden dropped the ball in what several media outlets deemed as the make-or-break moment for the President. Unfortunately, President Biden dropped the ball yet again by calling Vice President Trump to his Vice President Camilla Harris and mixing up Ukraine President Volodymyr Zelensky with Russian President Vladimir Putin. It was painful to watch them shaking hands just after President Biden made the mistake.
- At 12:30 GMT, June’s Producer Price Index (PPI) were released:
- Monthly headline PPI went from 0% to 0.2%.
- Monthly core PPI should jumped from 0.3% to 0.4%.
- Annual headline PPI jumped from 2.4% to 2.6%.
- Annual core PPI went from 2.6% to 3.%.
- At 14:00 GMT, the University of Michigan saw its initial reading for July miss estimates:
- Consumer Sentiment was expected to tick up to 68.5 from 68.2, though fell to 66 instead.
- 5-year consumer inflation was expected to remain at 3%, though came in at 2.9%.
- Equity markets are jumping higher and are in the green across the board for Europe and the US.
- The CME Fedwatch Tool is broadly backing a rate cut in September. The odds now stand at 86.4% for a 25-basis-point cut. A rate pause stands at a 7.5% chance, while a 50-basis-point rate cut has a slim 6.2% possibility.
- The US 10-year benchmark rate trades at 4.19%, printing a fresh low for 2024.
US Dollar Index Technical Analysis: Risky business now
The US Dollar Index (DXY) fell through several floors on Thursday in the aftermath of the CPI. Although a recovery took place right at the end of the trading session, pressure could come in again should PPI numbers also be in disinflation. Expect another pullback towards 104.00 with possibly a break lower in case Dollar bulls give up their position and cut their losses.
On the upside, a long road to recovery awaits. First up is the 100-day Simple Moving Average (SMA) near 104.81, just ahead of two heavy resistance levels, with the green ascending trend line in the chart below now as resistance near 104.95 and the 55-day SMA at 105.10. In case the DXY can puddle its way through all of that, 105.53 is the next upside level to look out for.
On the downside, the weak spot has been identified now at 103.99/104.00. Expect to see pressure mounting on that level with each test. Certainly, when the DXY bounces off that level each time, the bounces' highs would become smaller until the support gives way. Further down, a chunky decline is expected before finding the next vital support near 103.18.
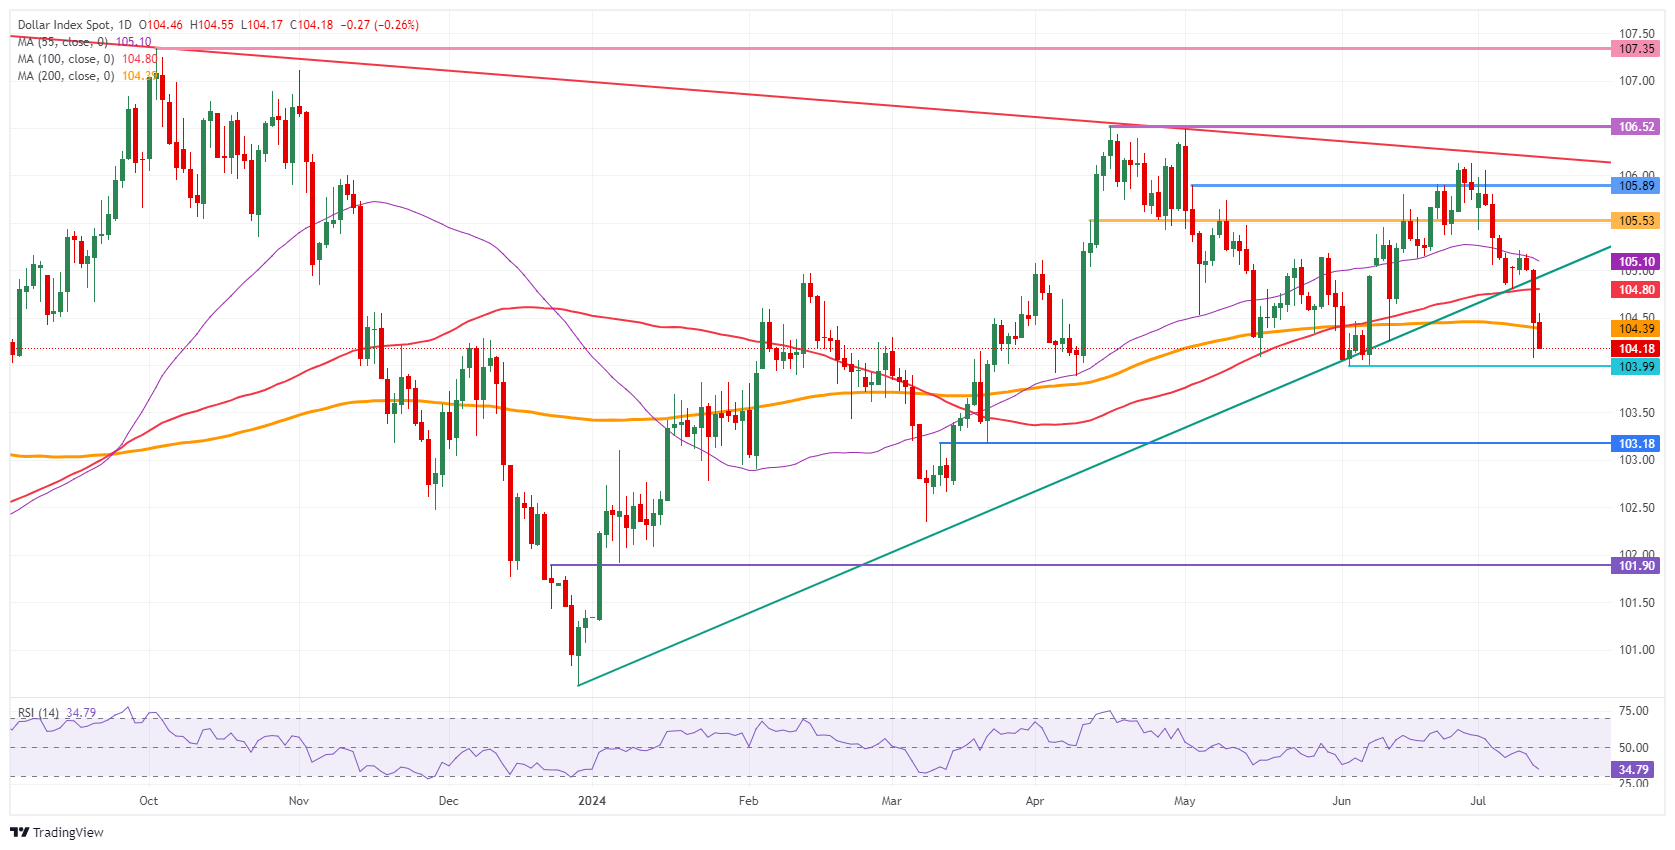
US Dollar Index: Daily Chart
Fed FAQs
Monetary policy in the US is shaped by the Federal Reserve (Fed). The Fed has two mandates: to achieve price stability and foster full employment. Its primary tool to achieve these goals is by adjusting interest rates. When prices are rising too quickly and inflation is above the Fed’s 2% target, it raises interest rates, increasing borrowing costs throughout the economy. This results in a stronger US Dollar (USD) as it makes the US a more attractive place for international investors to park their money. When inflation falls below 2% or the Unemployment Rate is too high, the Fed may lower interest rates to encourage borrowing, which weighs on the Greenback.
The Federal Reserve (Fed) holds eight policy meetings a year, where the Federal Open Market Committee (FOMC) assesses economic conditions and makes monetary policy decisions. The FOMC is attended by twelve Fed officials – the seven members of the Board of Governors, the president of the Federal Reserve Bank of New York, and four of the remaining eleven regional Reserve Bank presidents, who serve one-year terms on a rotating basis.
In extreme situations, the Federal Reserve may resort to a policy named Quantitative Easing (QE). QE is the process by which the Fed substantially increases the flow of credit in a stuck financial system. It is a non-standard policy measure used during crises or when inflation is extremely low. It was the Fed’s weapon of choice during the Great Financial Crisis in 2008. It involves the Fed printing more Dollars and using them to buy high grade bonds from financial institutions. QE usually weakens the US Dollar.
Quantitative tightening (QT) is the reverse process of QE, whereby the Federal Reserve stops buying bonds from financial institutions and does not reinvest the principal from the bonds it holds maturing, to purchase new bonds. It is usually positive for the value of the US Dollar.
Author

Filip Lagaart
FXStreet
Filip Lagaart is a former sales/trader with over 15 years of financial markets expertise under its belt.


