US Dollar Index Price Analysis: DXY bulls brace for fresh 2021 high
- DXY crossed monthly horizontal resistance, firmer of late.
- Sustained trading beyond key SMAs, bullish MACD signals favor buyers.
- Multiple bottoms around 95.85 add to the downside filters.
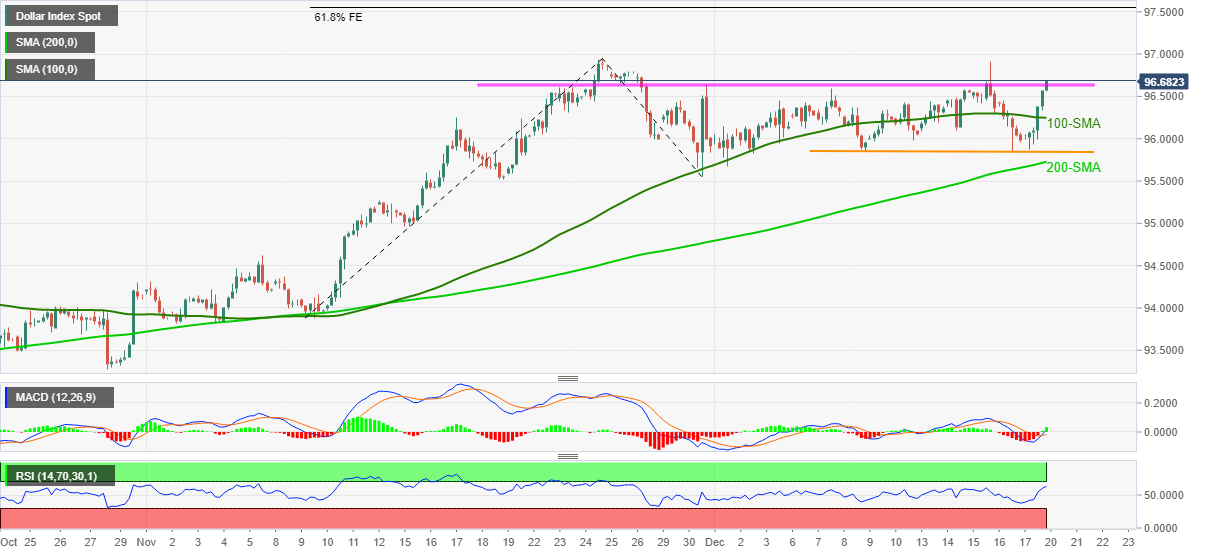
US Dollar Index (DXY) stays firmer, keeping Friday’s bullish breakout of monthly resistance near 96.70 during Monday’s Asian session.
In addition to the previous resistance breakout, bullish MACD signals and firmer RSI line, not overbought, also signal the greenback gauge’s further advances.
However, the 96.80 and the 97.00 levels may offer intermediate halts during the quote’s anticipated rally towards the 97.55 mark comprising 61.8% Fibonacci Expansion (FE) of November 09-30 moves.
Meanwhile, corrective pullback remains elusive until the quote stays beyond the resistance-turned-support near 96.60, a break of which will direct DXY towards a 100-SMA level of 96.25.
It should be noted, however, that a horizontal line from December 08 and 200-SMA, respectively near 95.85 and 95.70, will test the US Dollar Index bears afterward.
To sum up, DXY crossed the key hurdle to refresh the yearly top but further gains need validation.
DXY: Four-hour chart
Trend: Further upside expected
Author

Anil Panchal
FXStreet
Anil Panchal has nearly 15 years of experience in tracking financial markets. With a keen interest in macroeconomics, Anil aptly tracks global news/updates and stays well-informed about the global financial moves and their implications.


