US Dollar Index Price Analysis: DXY bears stay hopeful above 96.00
- DXY struggles to extend Monday’s rebound, stays below two-week-old channel.
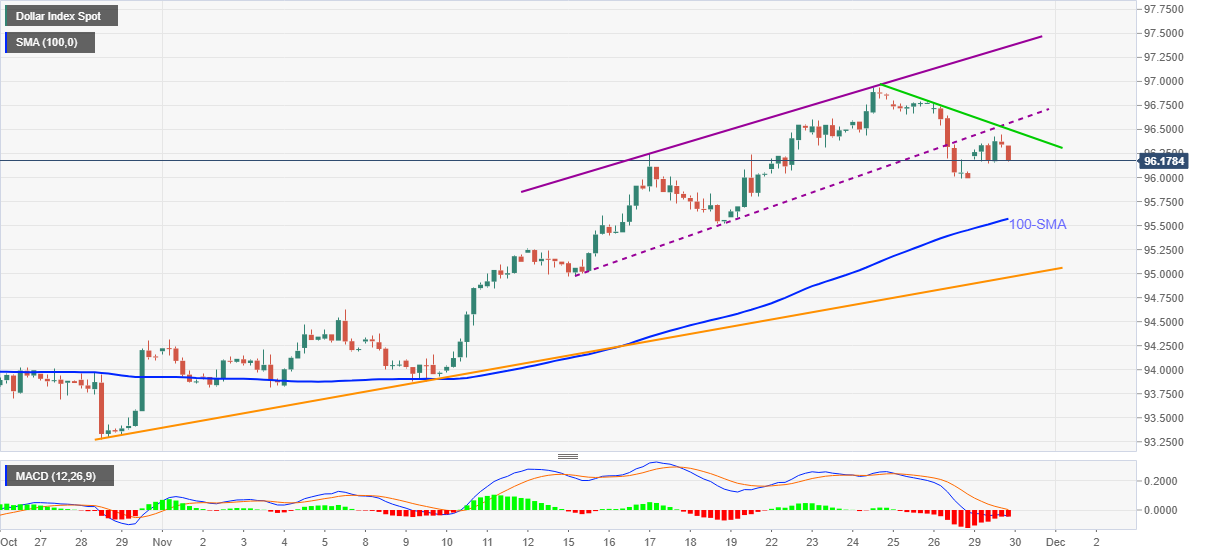
- Bearish MACD signals direct sellers towards 100-SMA but monthly support line will challenge the following downside.
- Weekly falling trend line offers immediate resistance, 97.00 is the key.

US Dollar Index (DXY) remains pressured towards 96.00, around 96.17 during Tuesday’s Asian session. The greenback gauge consolidated Friday’s heavy losses the previous day but failed to negate the downside break of a two-week-old ascending trend channel.
In addition to the confirmation of the bearish chart pattern, downbeat MACD signals and sustained trading below the weekly resistance line also weigh on the US Dollar Index.
That said, the quote drops towards the 100-SMA level of 95.57 by the press time but any further weakness will be challenged by an ascending support line from late October, around 95.00.
Should DXY bears keep reins past 95.00, the monthly low near 93.80 will be on their radars.
Alternatively, the stated weekly resistance line and the channel’s support, around 96.50-55, guards the quote’s immediate upside.
Following that, a run-up towards the 97.00 key hurdle can’t be ruled out. However, the stated channel’s resistance line near 97.40 could test the DXY bulls afterward.
DXY: Four-hour chart
Trend: Further weakness expected
Author

Anil Panchal
FXStreet
Anil Panchal has nearly 15 years of experience in tracking financial markets. With a keen interest in macroeconomics, Anil aptly tracks global news/updates and stays well-informed about the global financial moves and their implications.


