US Dollar sees rebound after upbeat ISM numbers
- The US Dollar off Monday's low after ISM numbers triggering some recovery.
- Markets got spooked on Monday in Asia with Japan's indiced dropping over 12%.
- The US Dollar index falls below 103.00, though recovers sharply on the back of stronger ISM numbers.

The US Dollar (USD) is recovering a touch in the US session after numbers from the Institute for Supply Management turned out better than expected. The main trigger for the sell off earlier, was the gruesome performance of the Japanese Nikkei and Topix Indices, which closed down over 12% in blood-red numbers. For the Nikkei, it is the worst performance since 1987, pushing investors and traders into safe-haven bonds. With falling yields, the US Dollar is losing its strength as a batch of weak US economic data and lower yields no longer make the Greenback shine.
On the economic front, the week started with a big batch of data from the Institute of Supply Management (ISM). All segments jumped higher, out of contraction, which helped spark the recover for the Greenback. Meanwhile, the US Federal Reserve (Fed) is trying to soothen markts a bit with some guidance and comments that a recession is not at hand.
Daily digest market movers: Goolsbee helps, ISM surprises
- President of the Federal Reserve Bank of Chicago Austan Goolsbee came out with suprise comments to calm markets by saying that the Fed is not seeing or forecasting a recession and that one jobs report is not enough to be fueling concerns.
- Markets are in panic mode on Monday after Japanese indices closed down by over 12%. Traders even priced in a 60% chance for an emergency rate cut in August at one point, Bloomberg reported. The Greenback is down near 3% against the Japanese Yen.
- At 13:45 GMT, the final readings of the S&P Global Purchasing Managers Index (PMI) for July was released:
- Services PMI came in at 55, from 56 previous.
- The Composite number went to 54.3, from 55 in its first reading.
- At 14:00 GMT, the Institute for Supply Management (ISM) for July came in:
- The Services Employment Index jumped from 46.1 to 51.1.
- Services New Orders Index went from 47.3 to 52.4.
- The Services PMI headed out of contraction and into growth from 48.8 to 51.4
- Services Paid Index remained stable from 56.3 to 57.
- Equity markets are falling out of bed on Monday, with the Japanese Nikkei facing its worst performance since 1987. US equities are off their lows and are starting to partially recover.
- The CME Fedwatch Tool shows a 96.5% chance of a 50 basis points (bps) interest rate cut by the Federal Reserve in September. Another 50 bps cut is expected in November by 78.6%, while a 20.6% chance of just a 25 bps cut is priced in that month.
- The US 10-year benchmark rate trades higher at 3.75%, away from the fresh low at 3.66% earlier this Monday.
US Dollar Index Technical Analysis: Repricing to new normal
The US Dollar Index (DXY) has cracked under pressure after the underperforming US economic data releases last week. On Monday, the equity rout continues and drags the Greenback lower. There are no clear support levels nearby, although the Relative Strength Index (RSI) points to the end of the sell off, with losses in Europe and the US for now being contained on the equity markets.
The recovery will be in three tiers, with the first up at 103.18, which was held on Friday though snapped on Monday in the Asian hours. Once the DXY closes above that level, next up is 104.00, which was the support from June. If the DXY can make its way back above that level, the 200-day Simple Moving Average (SMA) at 104.22 is the next resistance level to look out for.
On the downside, the oversold RSI already should refrain the DXY from making more hefty losses. Support nearby is the March 8 low at 102.35. Once through there, pressure will start to build on 102.00 as a big psychological figure, before testing 101.90, which was a pivotal level back in December 2023 and January 2024.
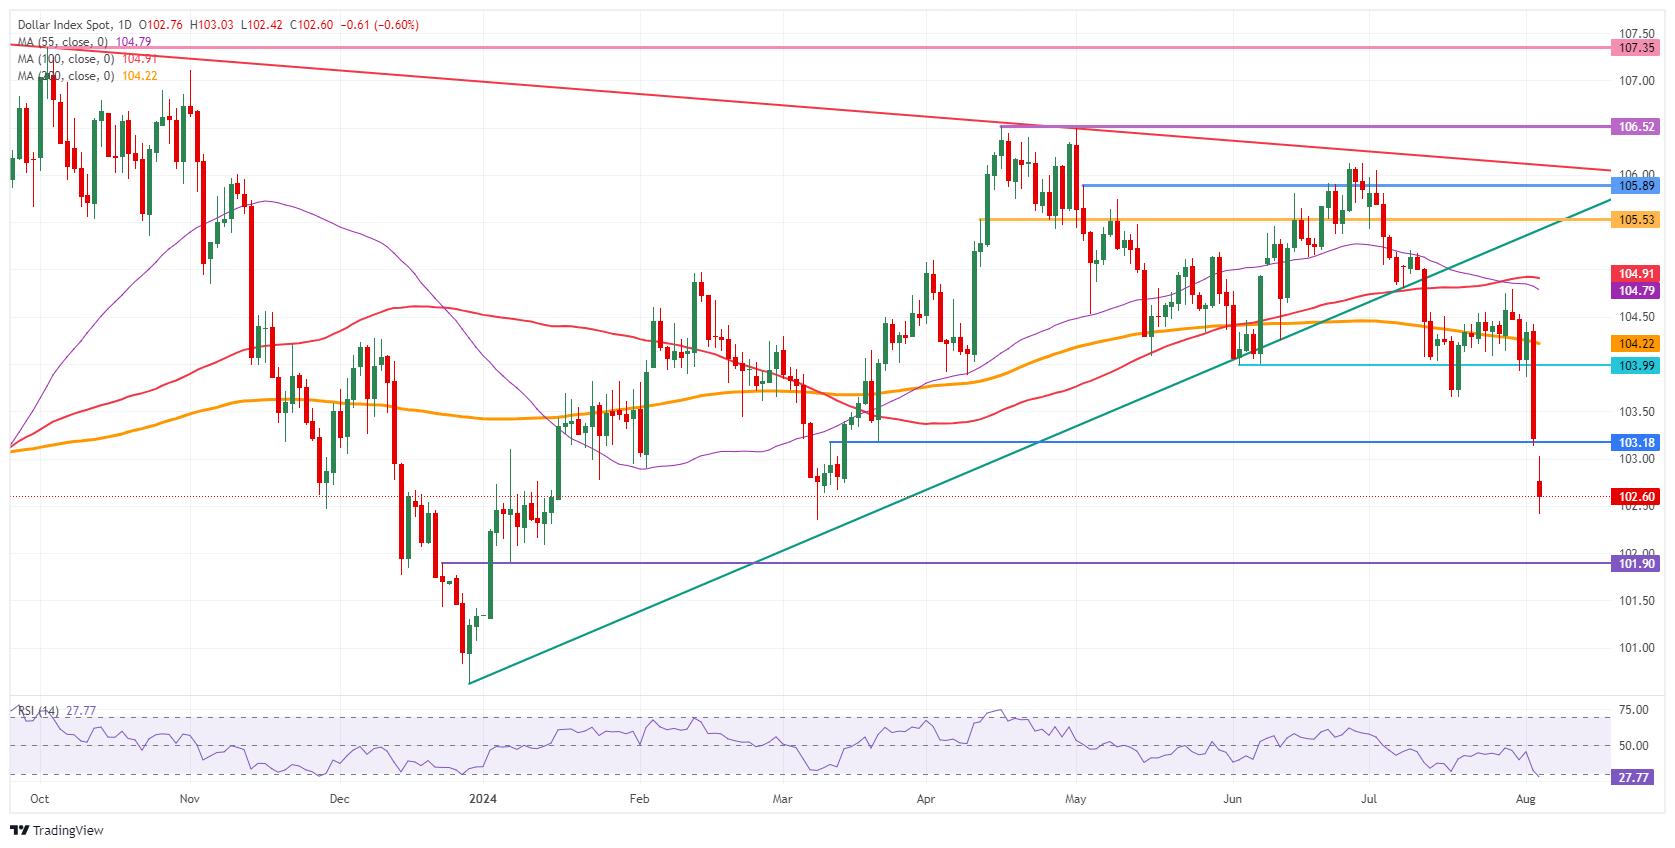
US Dollar Index: Daily Chart
Banking crisis FAQs
The Banking Crisis of March 2023 occurred when three US-based banks with heavy exposure to the tech-sector and crypto suffered a spike in withdrawals that revealed severe weaknesses in their balance sheets, resulting in their insolvency. The most high profile of the banks was California-based Silicon Valley Bank (SVB) which experienced a surge in withdrawal requests due to a combination of customers fearing fallout from the FTX debacle, and substantially higher returns being offered elsewhere.
In order to fulfill the redemptions, Silicon Valley Bank had to sell its holdings of predominantly US Treasury bonds. Due to the rise in interest rates caused by the Federal Reserve’s rapid tightening measures, however, Treasury bonds had substantially fallen in value. The news that SVB had taken a $1.8B loss from the sale of its bonds triggered a panic and precipitated a full scale run on the bank that ended with the Federal Deposit Insurance Corporation (FDIC) having to take it over.The crisis spread to San-Francisco-based First Republic which ended up being rescued by a coordinated effort from a group of large US banks. On March 19, Credit Suisse in Switzerland fell foul after several years of poor performance and had to be taken over by UBS.
The Banking Crisis was negative for the US Dollar (USD) because it changed expectations about the future course of interest rates. Prior to the crisis investors had expected the Federal Reserve (Fed) to continue raising interest rates to combat persistently high inflation, however, once it became clear how much stress this was placing on the banking sector by devaluing bank holdings of US Treasury bonds, the expectation was the Fed would pause or even reverse its policy trajectory. Since higher interest rates are positive for the US Dollar, it fell as it discounted the possibility of a policy pivot.
The Banking Crisis was a bullish event for Gold. Firstly it benefited from demand due to its status as a safe-haven asset. Secondly, it led to investors expecting the Federal Reserve (Fed) to pause its aggressive rate-hiking policy, out of fear of the impact on the financial stability of the banking system – lower interest rate expectations reduced the opportunity cost of holding Gold. Thirdly, Gold, which is priced in US Dollars (XAU/USD), rose in value because the US Dollar weakened.
Author

Filip Lagaart
FXStreet
Filip Lagaart is a former sales/trader with over 15 years of financial markets expertise under its belt.















