UISD/CAD Price Analysis: Post BoC stop hunt underway, 38.2% and 61.8% ratios eyed
- USD/CAD stop hunt is underway and the bears are eyeing the prior support structures.
- A 38.2% and 61.8% Fibo retracement is on the cards.

USD/CAD has started the stop hunt in the new hour following the conclusion to the Bank of Canada's red calendar event on Wednesday and ahead of key US data on Thursday.
The following illustrates the price action through the event and the move into in-the-money-longs that could continue all the way into the Fibonacci scale, with the 38.2% and 61.8% ratios eyed.
USD/CAD MTF analysis
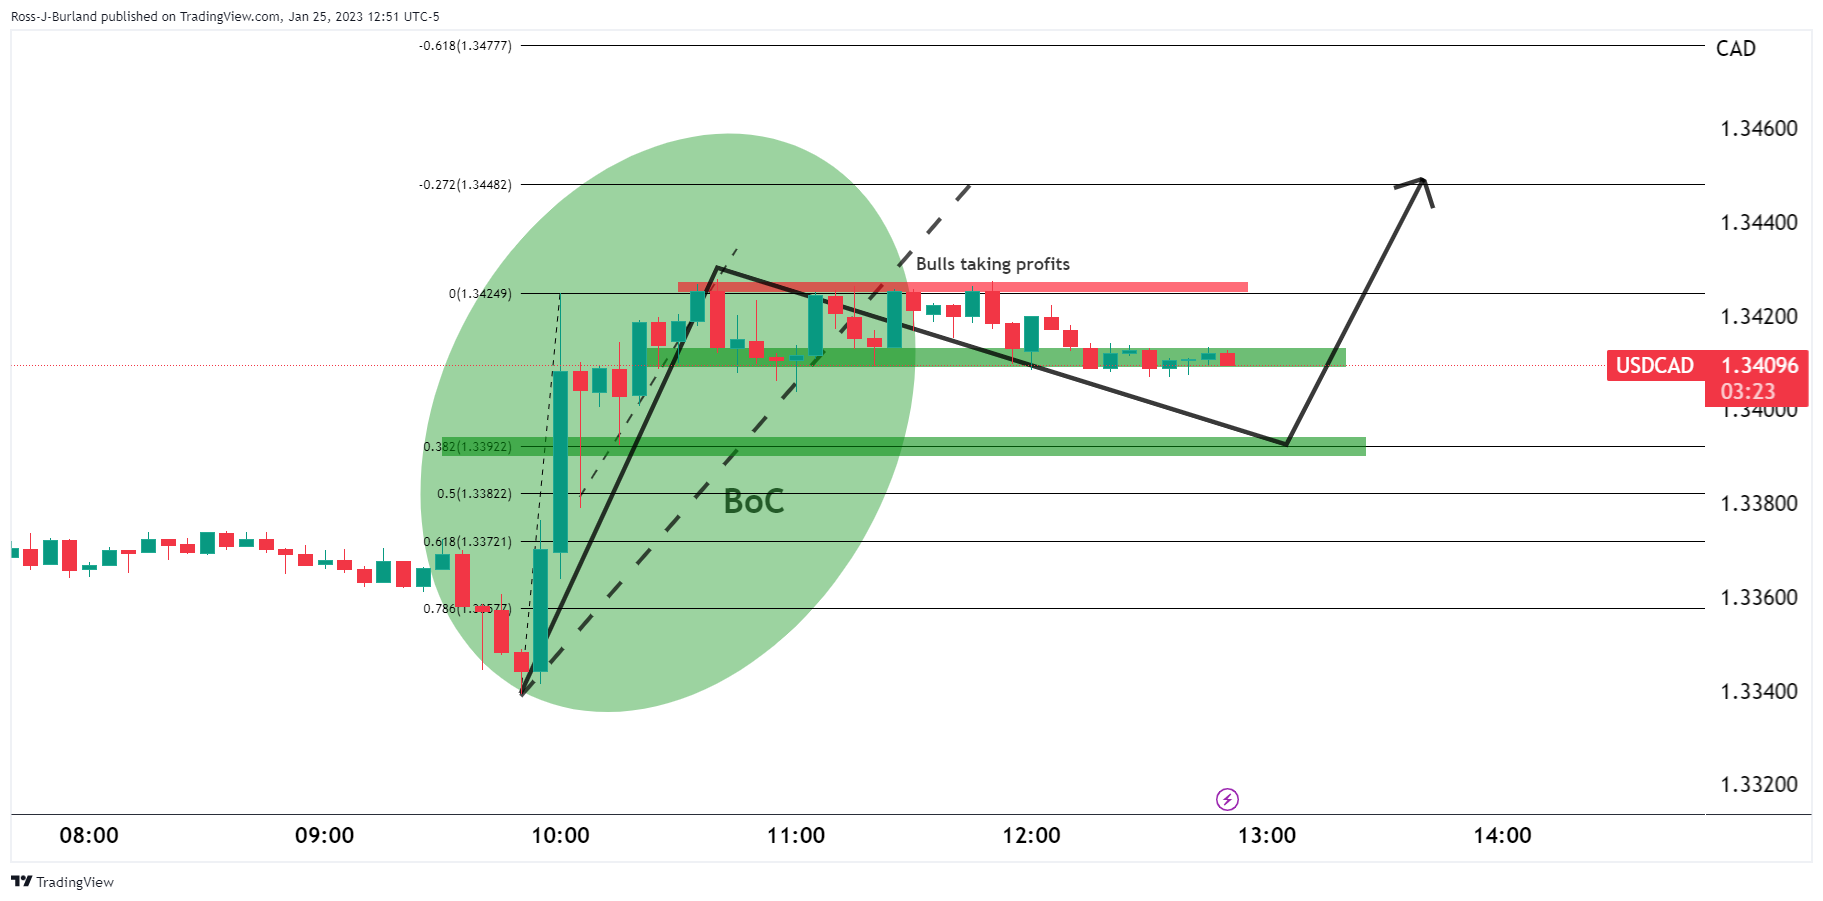
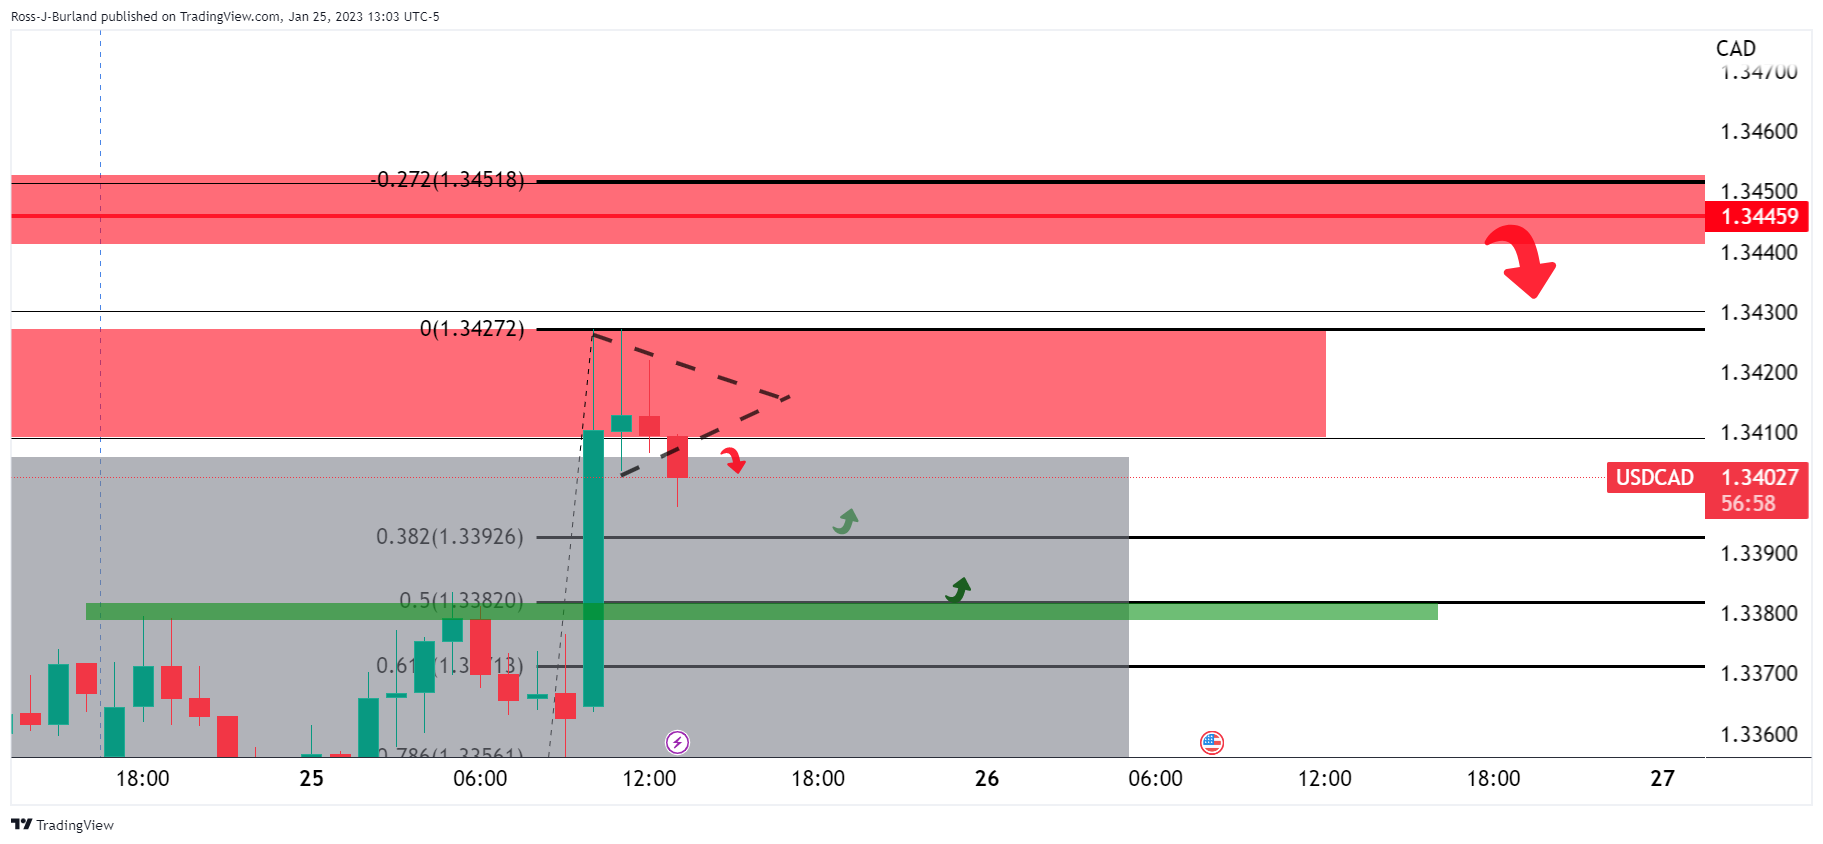
Before the new hour, the above schematic was playing out bearish due to failures to run higher through resistance and sliding to the backside of the bullish trendline support.
USD/CAD daily charts
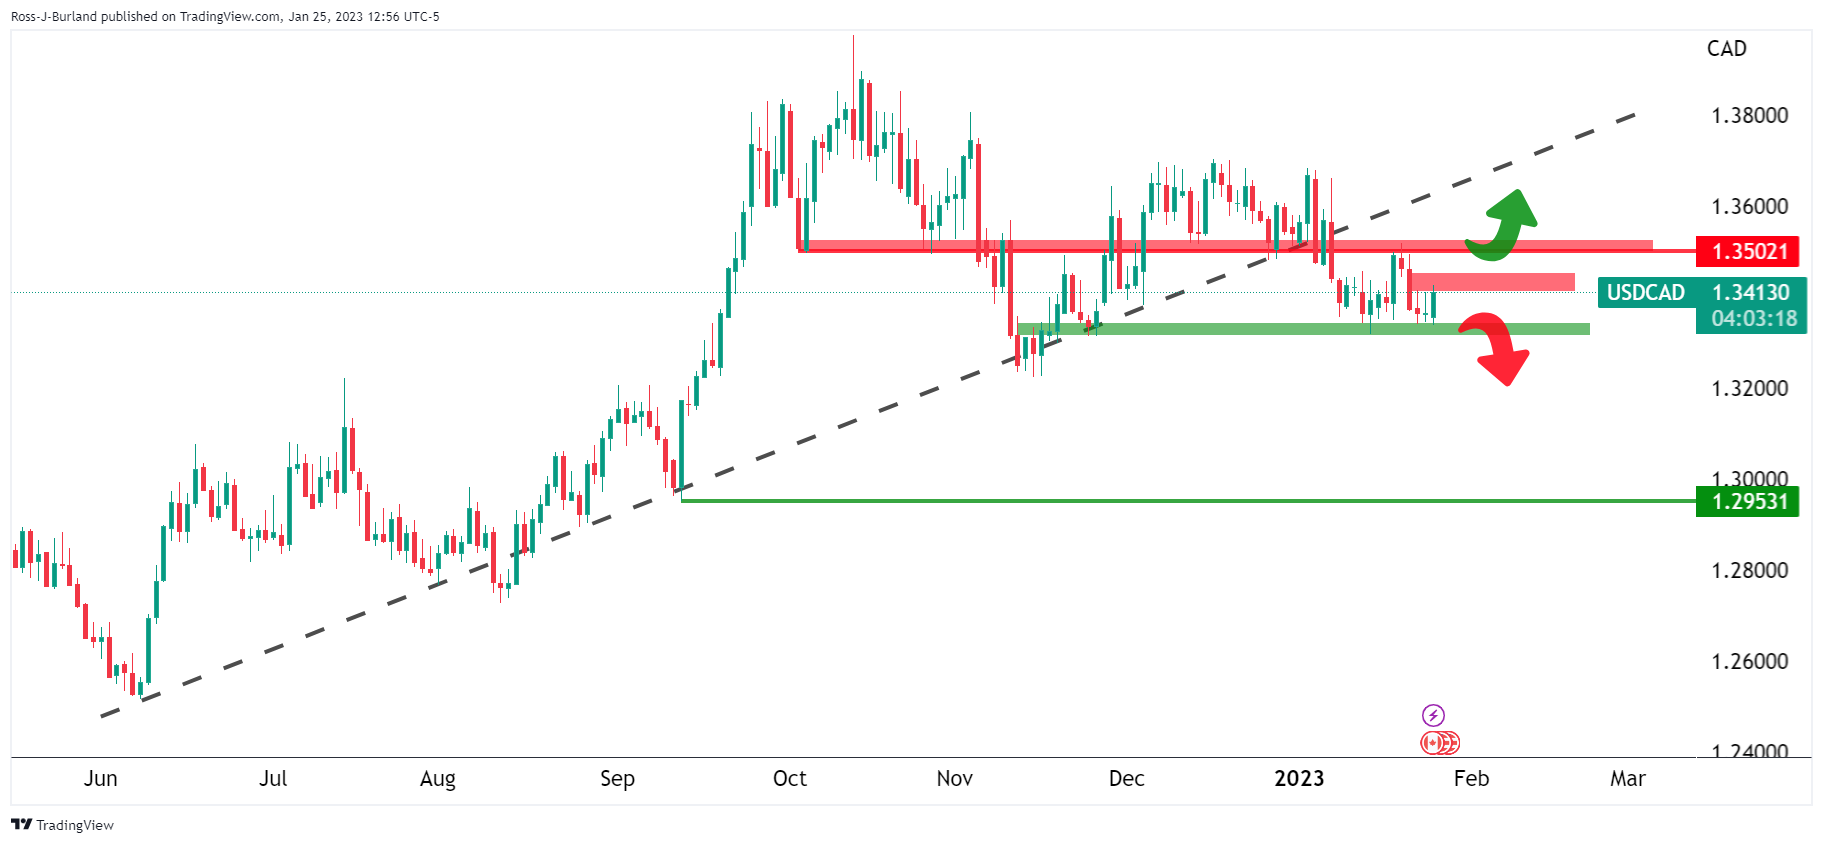
That does not mean that there would not be prospects of a bullish breakout as per the above daily chart. There are prospects of a move higher following a stop hunt:
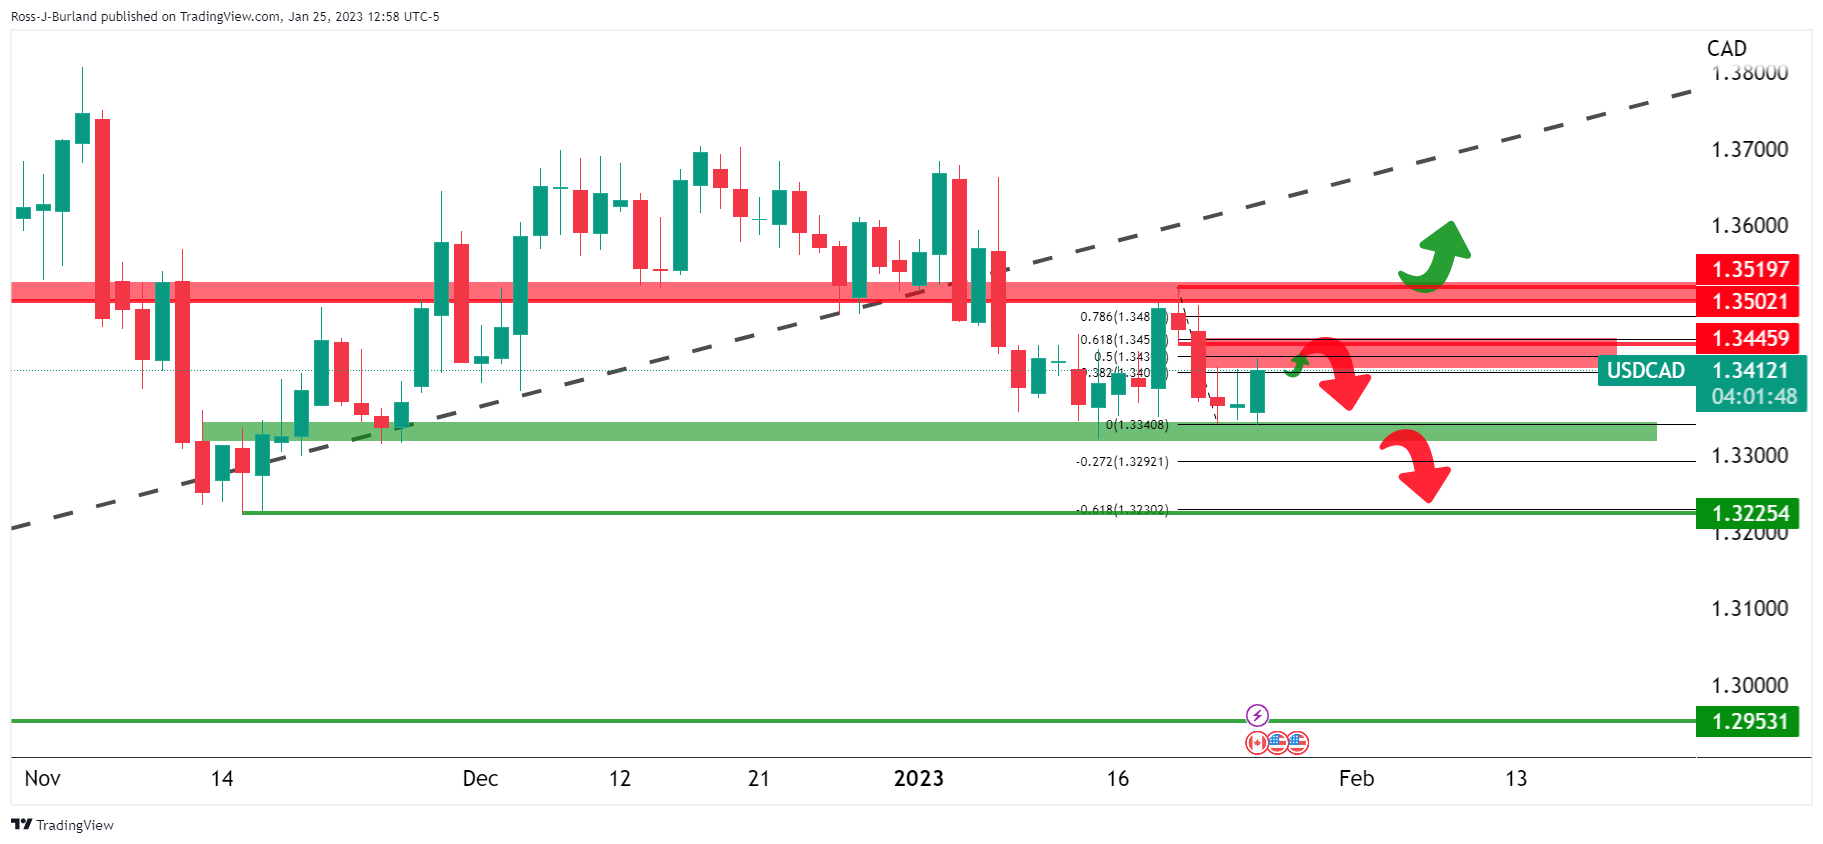
USD/CAD H1 charts
The price is trapped in a box (greyed area) between resistance and support. The BoC rally was decelerating into a triangle and a breakout was inevitable with the path of least resistance to the downside:
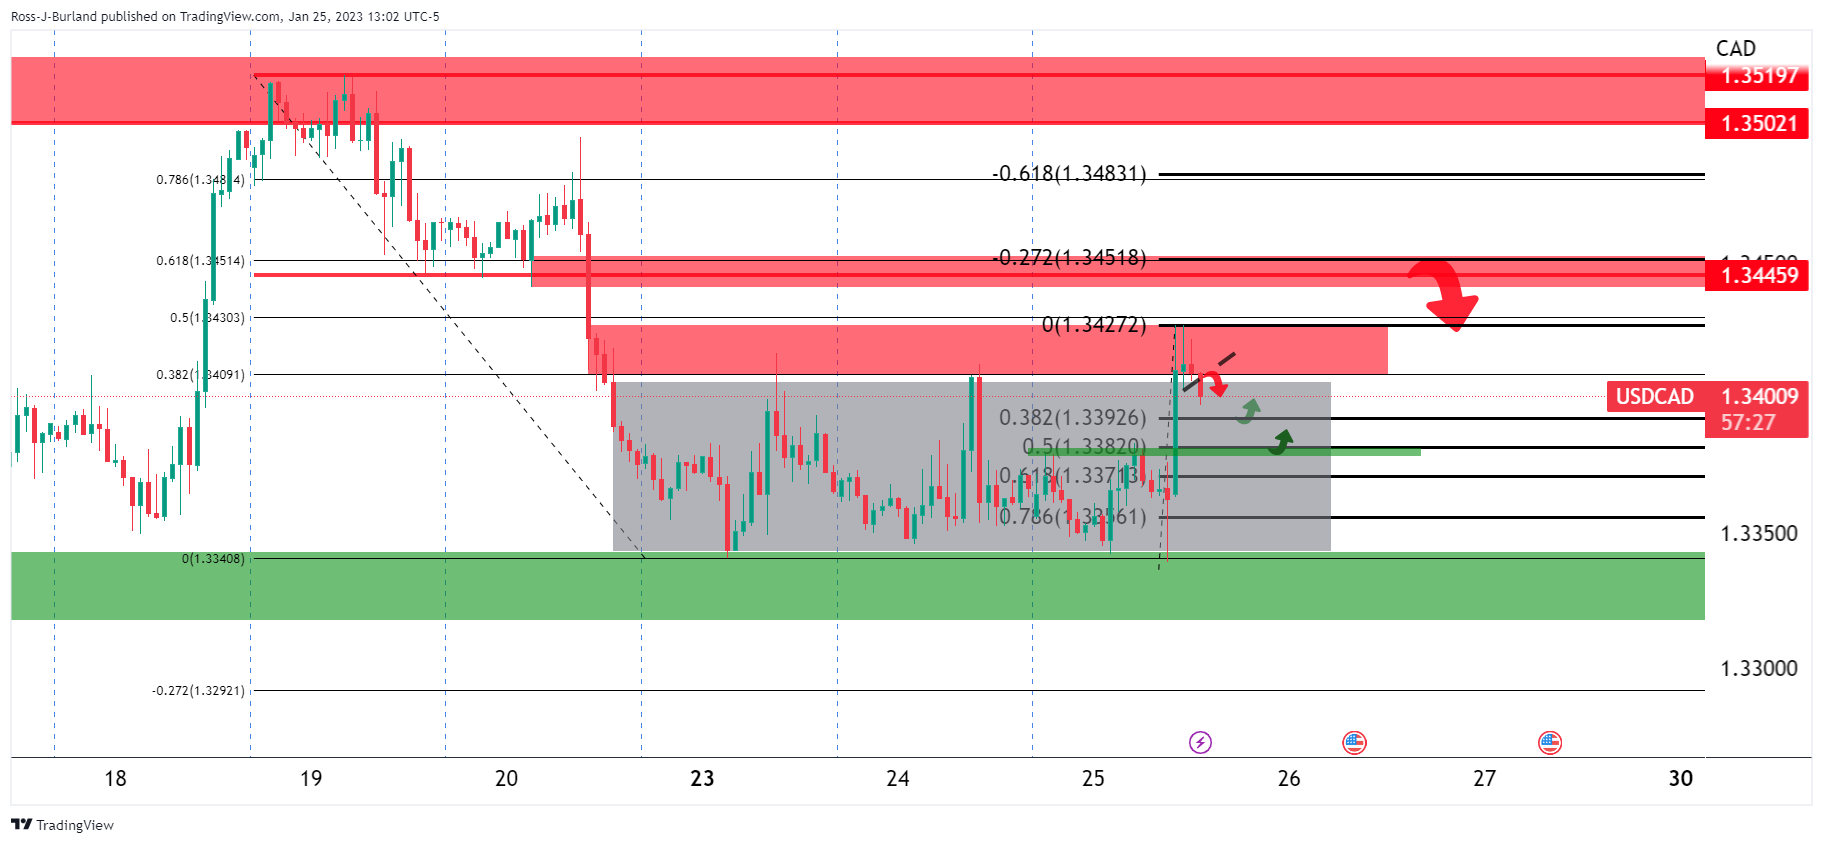
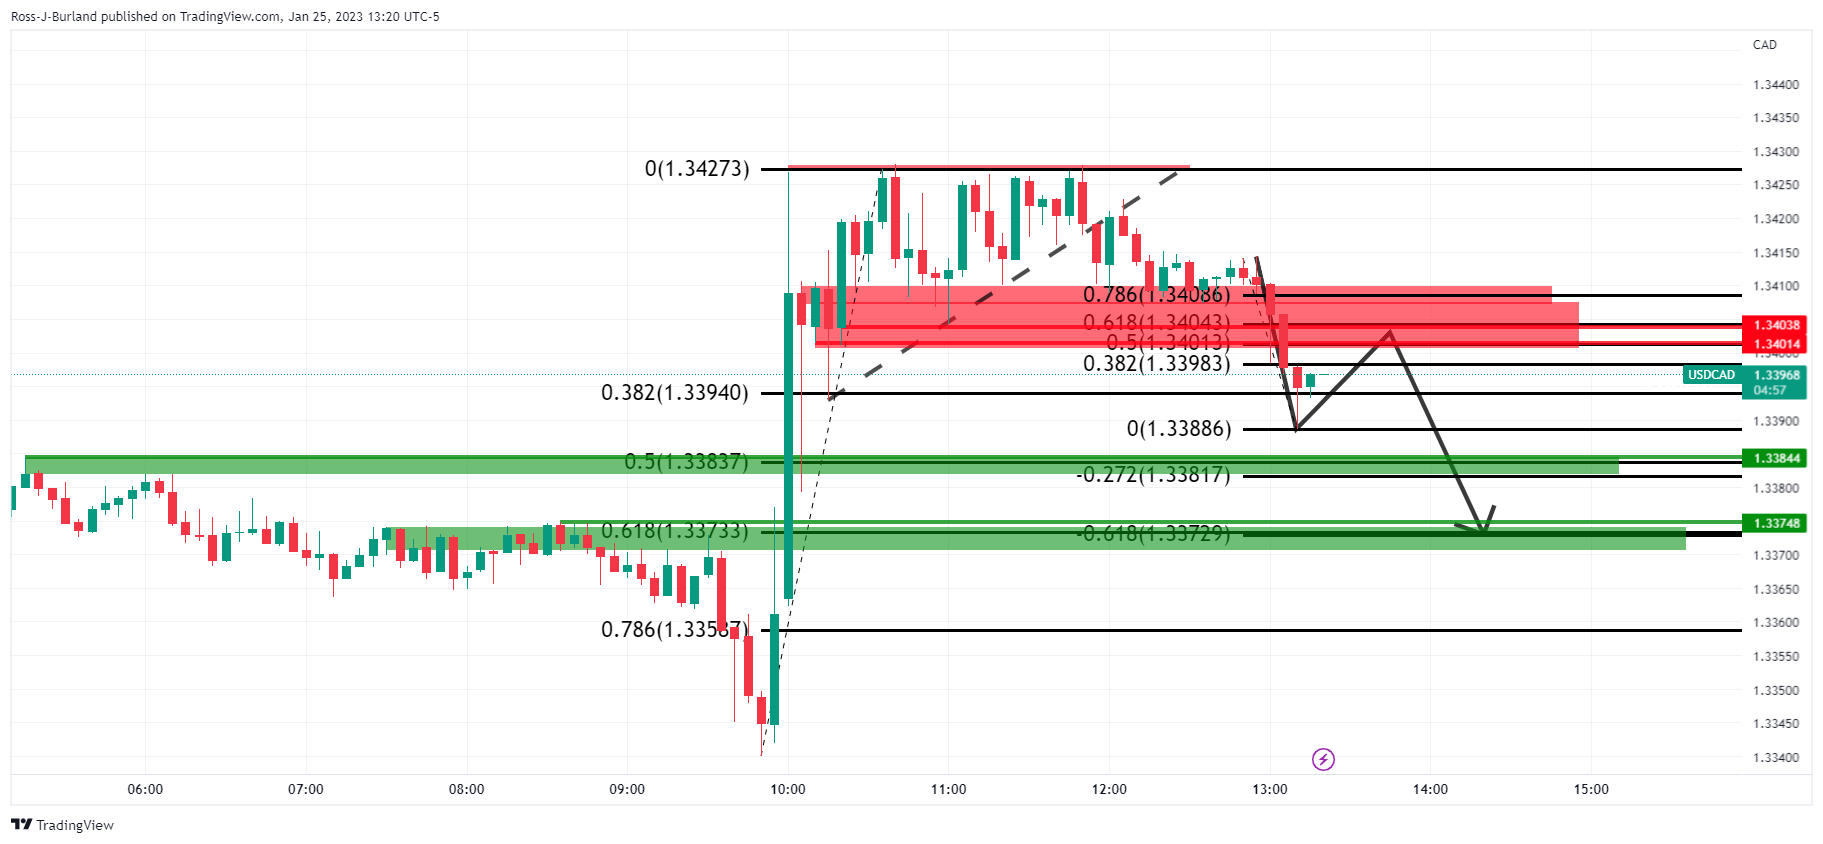
The stop hunt is underway as seen above. The Structures are as follows as per the 5-min chart:
Author

Ross J Burland
FXStreet
Ross J Burland, born in England, UK, is a sportsman at heart. He played Rugby and Judo for his county, Kent and the South East of England Rugby team.


