Tesla Stock Forecast: TSLA has further room to fall as institutions show bearish impulse
- Goldman Sachs noted on Wednesday that Tesla is a favorite short among hedge funds.
- Likewise, mutual funds as a class hold TSLA as an underweight position.
- At the end of October, nearly $17 billion worth of short interest was seen in TSLA.
- TSLA stock has been in a downtrend on the daily chart since mid-July.

Tesla (TSLA) stock closed up 0.28% on Wednesday, outperforming the NASDAQ Composite, which dropped 0.58%. However, institutional bearishness parallels the general downtrend over the past four months and CEO Elon Musk’s recent ho-hum Cybertruck event.
Goldman Sachs released a report on Wednesday concerning research about which stocks are witnessing agreement between mutual funds and hedge funds. Unfortunately for TSLA stock investors, both types of institutions on average are bearish on the leading electric vehicle (EV) company.
Tesla stock news
Goldman’s research report looked at the similarities and divergences between major S&P 500 stocks held by hedge funds and mutual funds. Goldman said that overlap between the two categories of investment managers typically leads to outperformance.
Tesla stock was notably the only one of the Magnificent Seven – Apple, Amazon, Microsoft, Tesla, Nvidia, Meta Platforms, Alphabet – that did not make it to the overlapping long list. Instead, TSLA stock was listed under the banner of stocks that were both underweight among mutual funds and heavy shorts by hedge funds.
Though the data is somewhat dated, as of October 31, $16.9 billion worth of TSLA stock was held short or 3% of its float. Based on Goldman’s research, Tesla is the top short by value among hedge funds. Other notable shorts are ExxonMobil (XOM), Intel (INTC) and RTX Corp. (RTX).
Tesla’s gain on Wednesday was fairly measured compared to other names like Rivian Automotive (RIVN) and Nio (NIO). Long-dated Treasury yields sank on Wednesday, which has helped the risk-on mood. Nio is benefiting from a report that it is planning to spin off its battery manufacturing business in order to become more profitable.
Lithium stocks powered higher on Wednesday as US regulations regarding the EV supply chain were less strict than expected. Most of the new rules regard protecting US EV tax credits from benefiting Chinese companies. Crude Oil (WTI) also dropped below $70 a barrel in the session.
Nasdaq FAQs
What is the Nasdaq?
The Nasdaq is a stock exchange based in the US that started out life as an electronic stock quotation machine. At first, the Nasdaq only provided quotations for over-the-counter (OTC) stocks but later it became an exchange too. By 1991, the Nasdaq had grown to account for 46% of the entire US securities’ market. In 1998, it became the first stock exchange in the US to provide online trading. The Nasdaq also produces several indices, the most comprehensive of which is the Nasdaq Composite representing all 2,500-plus stocks on the Nasdaq, and the Nasdaq 100.
What is the Nasdaq 100?
The Nasdaq 100 is a large-cap index made up of 100 non-financial companies from the Nasdaq stock exchange. Although it only includes a fraction of the thousands of stocks in the Nasdaq, it accounts for over 90% of the movement. The influence of each company on the index is market-cap weighted. The Nasdaq 100 includes companies with a significant focus on technology although it also encompasses companies from other industries and from outside the US. The average annual return of the Nasdaq 100 has been 17.23% since 1986.
How can I trade the Nasdaq 100?
There are a number of ways to trade the Nasdaq 100. Most retail brokers and spread betting platforms offer bets using Contracts for Difference (CFD). For longer-term investors, Exchange-Traded Funds (ETFs) trade like shares that mimic the movement of the index without the investor needing to buy all 100 constituent companies. An example ETF is the Invesco QQQ Trust (QQQ). Nasdaq 100 futures contracts allow traders to speculate on the future direction of the index. Options provide the right, but not the obligation, to buy or sell the Nasdaq 100 at a specific price (strike price) in the future.
What Factors Drive the Nasdaq 100
Many different factors drive the Nasdaq 100 but mainly it is the aggregate performance of the component companies revealed in their quarterly and annual company earnings reports. US and global macroeconomic data also contributes as it impacts on investor sentiment, which if positive drives gains. The level of interest rates, set by the Federal Reserve (Fed), also influences the Nasdaq 100 as it affects the cost of credit, on which many corporations are heavily reliant. As such the level of inflation can be a major driver too as well as other metrics which impact on the decisions of the Fed.
Tesla stock forecast
Tesla stock has been stuck in a downtrend since reaching a range high just under $300 on July 19. Just last week, TSLA once again bounced lower after reaching the topline of the descending price channel. That failure to breach the topline led to three consecutive down days, also known as Three Black Crows. This typically signals a bearish reversal is in order.
The first confirmation, after possibly retesting the descending topline, would be a break of the 9-day Simple Moving Average (SMA), which now trades just below $240. The another break of the 21-day SMA at $233 would lead traders to expect a sell-off to the $210 support floor. If TSLA stock continues its full price channel rotation, then the EV stock would descend all the way to test the bottom line in the $180s.
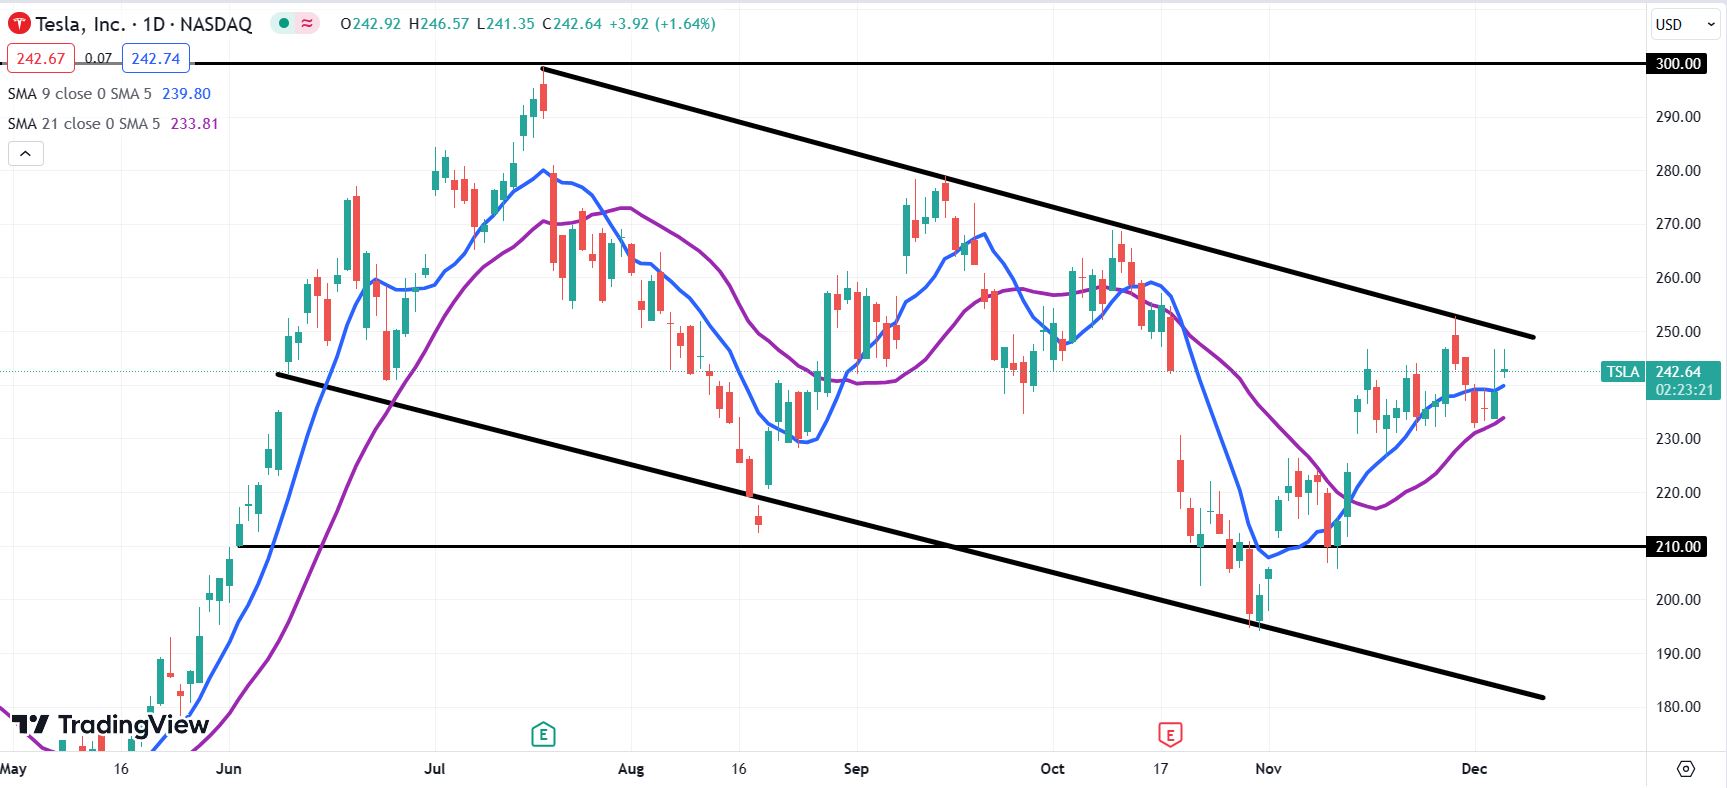
TSLA daily chart
Premium
You have reached your limit of 3 free articles for this month.
Start your subscription and get access to all our original articles.
Author

Clay Webster
FXStreet
Clay Webster grew up in the US outside Buffalo, New York and Lancaster, Pennsylvania. He began investing after college following the 2008 financial crisis.