Tesla Stock Forecast: TSLA holds above $210 support as equity market swells
- HSBC hands TSLA stock a Reduce rating and price target of $146.
- Tesla stock is consolidating right on top of $210 support level.
- HSBC analyst says too much of Tesla growth story comes at end of decade.
- President Joe Biden supports UAW attempt to unionize Tesla factories.

Tesla (TSLA) stock is holding onto a 2.3% gain into the close on Friday afternoon, ahead of the NASDAQ Composite, which has rallied 1.9%. TSLA stock is hovering just above an important support zone at $210. Should it give way, shareholders could experience a 24% drop to long-term support. A negative analyst report on Thursday dealt a major blow to the leading electric vehicle (EV) purveyor, and the US President gave his backing to the United Auto Workers (UAW) in its attempt to unionize the company run by Elon Musk.
The US equity market is surging late Friday as the S&P 500 and NASDAQ Composite each look to close between 1% and 2% higher.
Tesla stock news: $146 price target a black mark on Tesla stock’s outlook
HSBC analyst Michael Tyndall surprised shareholders on Thursday with his Reduce rating (HSBC speak for Sell) on top of a $146 price target. Tyndall’s research did not treat Tesla as a poor investment, and in fact he admitted that Tesla largely fulfills its ambitious promises over the long run.
The problem, as Tyndall sees it, is that Tesla’s valuation appears to be based on several major investments that won’t acrue to the bottom line until the end of the decade. These include Tesla’s long-hyped fully autonomous software that is likely to require a subscription, its Optimus robots and its emerging Dojo supercomputer service.
Tesla is publicly aiming for production of 20 million vehicles annually by the end of the decade, but Tyndall says this is likely too ambitious based on the current trajectory of the worldwide transition to EVs. For comparison, that figure is about twice the current level of both Toyota (TM) and Volkswagen (VWAGY) – the two largest auto companies.
Additionally, Tyndall said that CEO Elon Musk presents “single man” risk. This is not a knock on Musk’s forays into multiple other ventures such as Twitter ,but that the company’s valuation may rely too much on Musk leading it. If something were to happen to Musk, the market’s enthusiasm for Tesla stock could plummet.
Another worry for shareholders is not new. President Joe Biden met with UAW autoworkers on Thursday and put his bully pulpit behind that union’s strategy of seeking to unionize Musk’s company, as well as Toyota. The UAW is coming off a string of wins against Ford (F), Stellantis (STLA) and General Motors (GM) last month, and Biden was effective at providing the UAW’s strike with direct political support.
The market may not pay much attention to the danger of unionization to profit margins as the UAW already failed to unionize Musk’s California factory before and is sure to have more trouble unionizing Tesla’s other production hubs in Nevada and Texas.
Nasdaq FAQs
What is the Nasdaq?
The Nasdaq is a stock exchange based in the US that started out life as an electronic stock quotation machine. At first, the Nasdaq only provided quotations for over-the-counter (OTC) stocks but later it became an exchange too. By 1991, the Nasdaq had grown to account for 46% of the entire US securities’ market. In 1998, it became the first stock exchange in the US to provide online trading. The Nasdaq also produces several indices, the most comprehensive of which is the Nasdaq Composite representing all 2,500-plus stocks on the Nasdaq, and the Nasdaq 100.
What is the Nasdaq 100?
The Nasdaq 100 is a large-cap index made up of 100 non-financial companies from the Nasdaq stock exchange. Although it only includes a fraction of the thousands of stocks in the Nasdaq, it accounts for over 90% of the movement. The influence of each company on the index is market-cap weighted. The Nasdaq 100 includes companies with a significant focus on technology although it also encompasses companies from other industries and from outside the US. The average annual return of the Nasdaq 100 has been 17.23% since 1986.
How can I trade the Nasdaq 100?
There are a number of ways to trade the Nasdaq 100. Most retail brokers and spread betting platforms offer bets using Contracts for Difference (CFD). For longer-term investors, Exchange-Traded Funds (ETFs) trade like shares that mimic the movement of the index without the investor needing to buy all 100 constituent companies. An example ETF is the Invesco QQQ Trust (QQQ). Nasdaq 100 futures contracts allow traders to speculate on the future direction of the index. Options provide the right, but not the obligation, to buy or sell the Nasdaq 100 at a specific price (strike price) in the future.
What Factors Drive the Nasdaq 100
Many different factors drive the Nasdaq 100 but mainly it is the aggregate performance of the component companies revealed in their quarterly and annual company earnings reports. US and global macroeconomic data also contributes as it impacts on investor sentiment, which if positive drives gains. The level of interest rates, set by the Federal Reserve (Fed), also influences the Nasdaq 100 as it affects the cost of credit, on which many corporations are heavily reliant. As such the level of inflation can be a major driver too as well as other metrics which impact on the decisions of the Fed.
Tesla stock forecast
Tesla’s weekly chart showcases just how important the $210 level is for bulls. Tesla stock has already dropped below it on several occasions over the past two weeks, so the willpower is there for a move lower. The $210 level’s significance comes from its supportive posture in the summers of 2021 and 2022. It then became resistance in February of this year before slowing down a share price plunge in August.
The 8-week Simple Moving Average (SMA) is also on the cusp of breaking below the 30-week SMA, and that move will signal to traders that the autumn pullback is not over. A major weekly close on Friday or next week well below the $210 level could have traders heading for the exits. Below that support, the $160 level that held up multiple times in April is the next best bet. That price tag would mean a 24% haircut though from current price action.
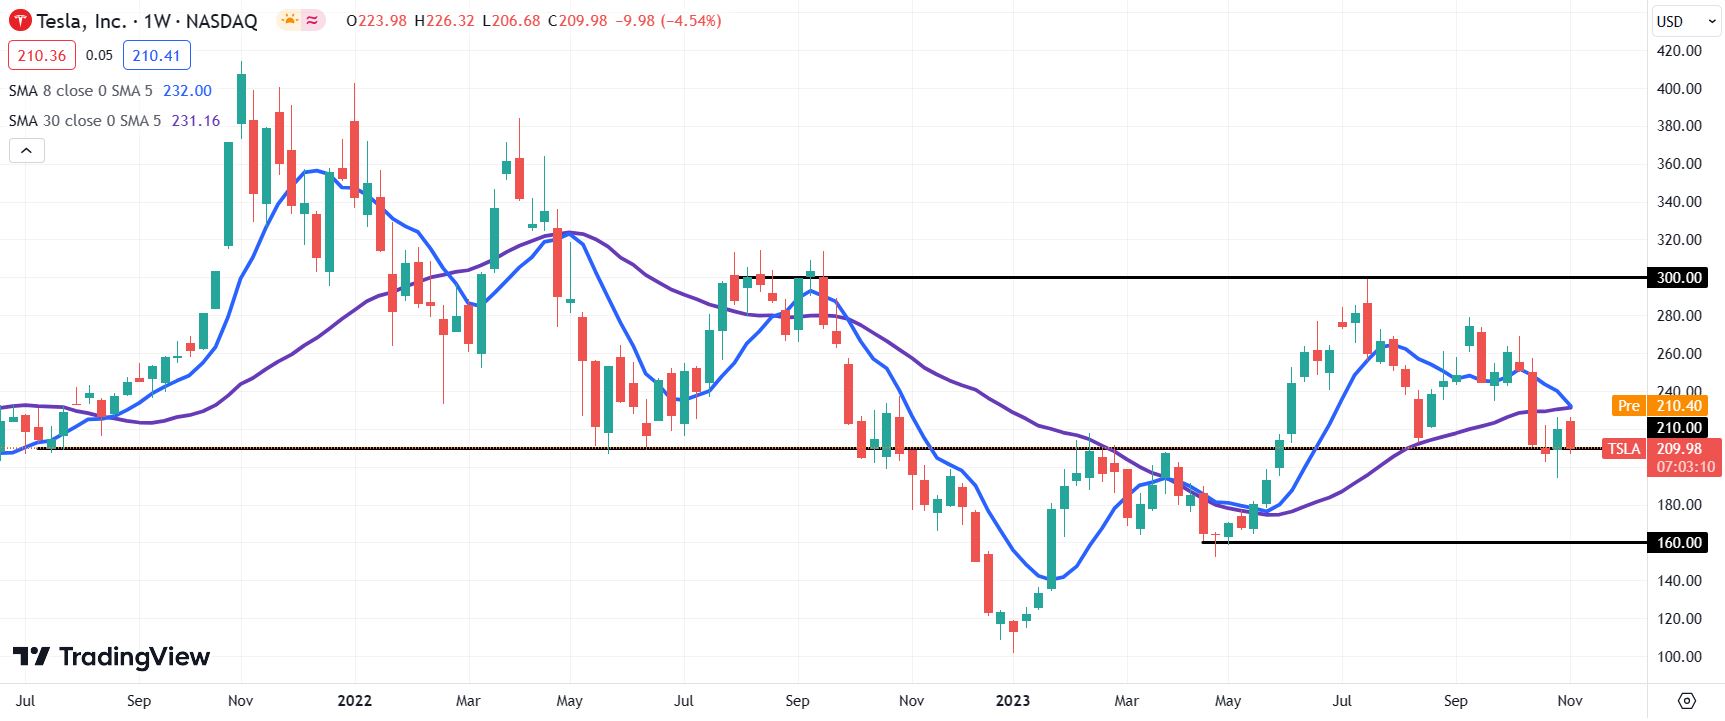
TSLA weekly chart
Author

Clay Webster
FXStreet
Clay Webster grew up in the US outside Buffalo, New York and Lancaster, Pennsylvania. He began investing after college following the 2008 financial crisis.


