SPDR S&P 500 ETF (SPY) News and Forecast: Will SPY keep sailing higher or will CPI distract?
- SPY continues to frustrate the herd who expect a pullback.
- SPY shorts are beginning to cover in the latest Commitment of Traders report.
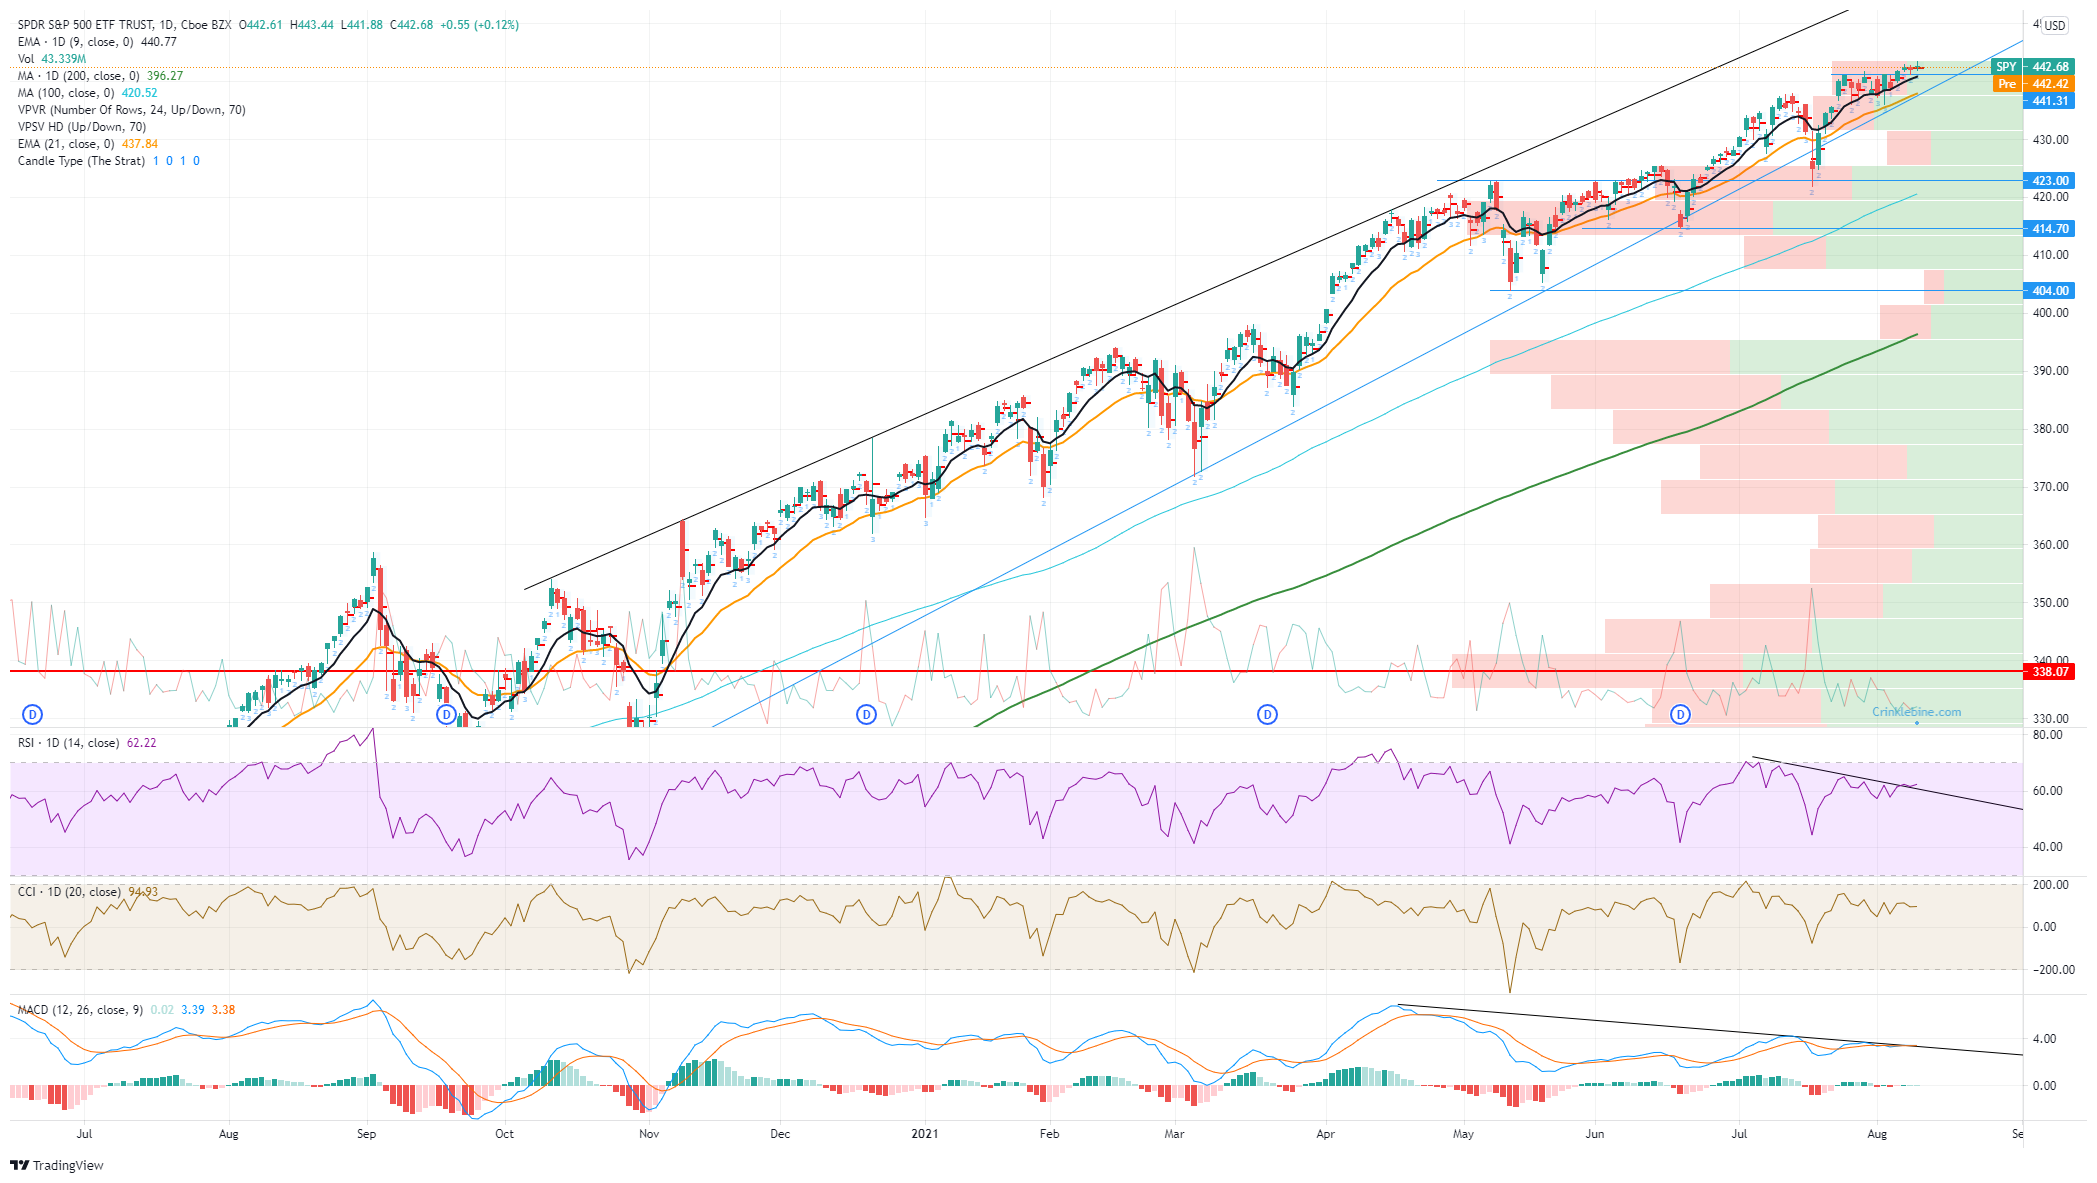
- SPY chart looks technically overbought, but this can continue.

The S&P 500 ETF (SPY) continues to confound many seasoned commentators looking for a late summer sell-off. The market by most metrics is overbought with the whole system being pumped by the Fed money printing program. However, as we keep saying here at FXStreet, price is the ultimate indicator, and that keeps going up. The move is slowing with grinding moves higher frustrating many who have taken fresh short positions. The latest data from the CFTC shows fund managers have trimmed long positions and that speculators have covered some short positions.
The main metrics we look to for market breadth remain mostly in bullish formation. The number of stocks making 52-week highs continues to bounce with 123 new 52-week highs on Tuesday versus 28 on July 19. The percentage of stocks trading above their 200-day moving average also bottomed on July 19 at 57% and has currently bounced to 62%.
The trend this week has been a steady grind, but things are set to get a bit more interesting today with the release of the Consumer Price Index. Inflation has been taken off the traders' worry list since before the summer as the Fed released a string of doveish speakers to insert the "transitory" phrase into the mindset of equity traders. Having examined the latest earnings season for clues though, we have noted an increasing number of earnings reports allude to bottleneck, supply constraints, input costs, etc. All this leads us to believe the inflation genie is set to be released again. The US 10-year is certainly thinking along the same lines with the yield moving steadily up over the last few sessions.
SPY stock forecast
We are putting our neck on the line here and calling for a worrying inflation report and a dip in the SPY. Recently, we have seen bearish divergences across the Relative Strength Index (RSI), Commodity Channel Index (CCI) and Moving Average Convergence Divergence (MACD). The question is will this be another chance to buy the dip or the start of something bigger. Short-term support at $441.31 will likely give way to a small support zone at $430 with the volume profile lending support here. The prefered buying point though is at $414.70. This may seem like a strong call, nearly 10%, but it only brings us back to where the SPY was trading in July. The volume profile is at its strongest here, so this level needs to hold. A break could be sharp, as volume dries up worryingly until $390.
Like this article? Help us with some feedback by answering this survey:
Premium
You have reached your limit of 3 free articles for this month.
Start your subscription and get access to all our original articles.
Author

Ivan Brian
FXStreet
Ivan Brian started his career with AIB Bank in corporate finance and then worked for seven years at Baxter. He started as a macro analyst before becoming Head of Research and then CFO.


