The S&P 500 finished another week in negative territory, shedding -1.6% (-2.5% MTD). While it is clear that this market remains the domain of buyers, 90% of the upside in March has been reclaimed, and evidence is building for a deeper correction.

Deeper correction possible

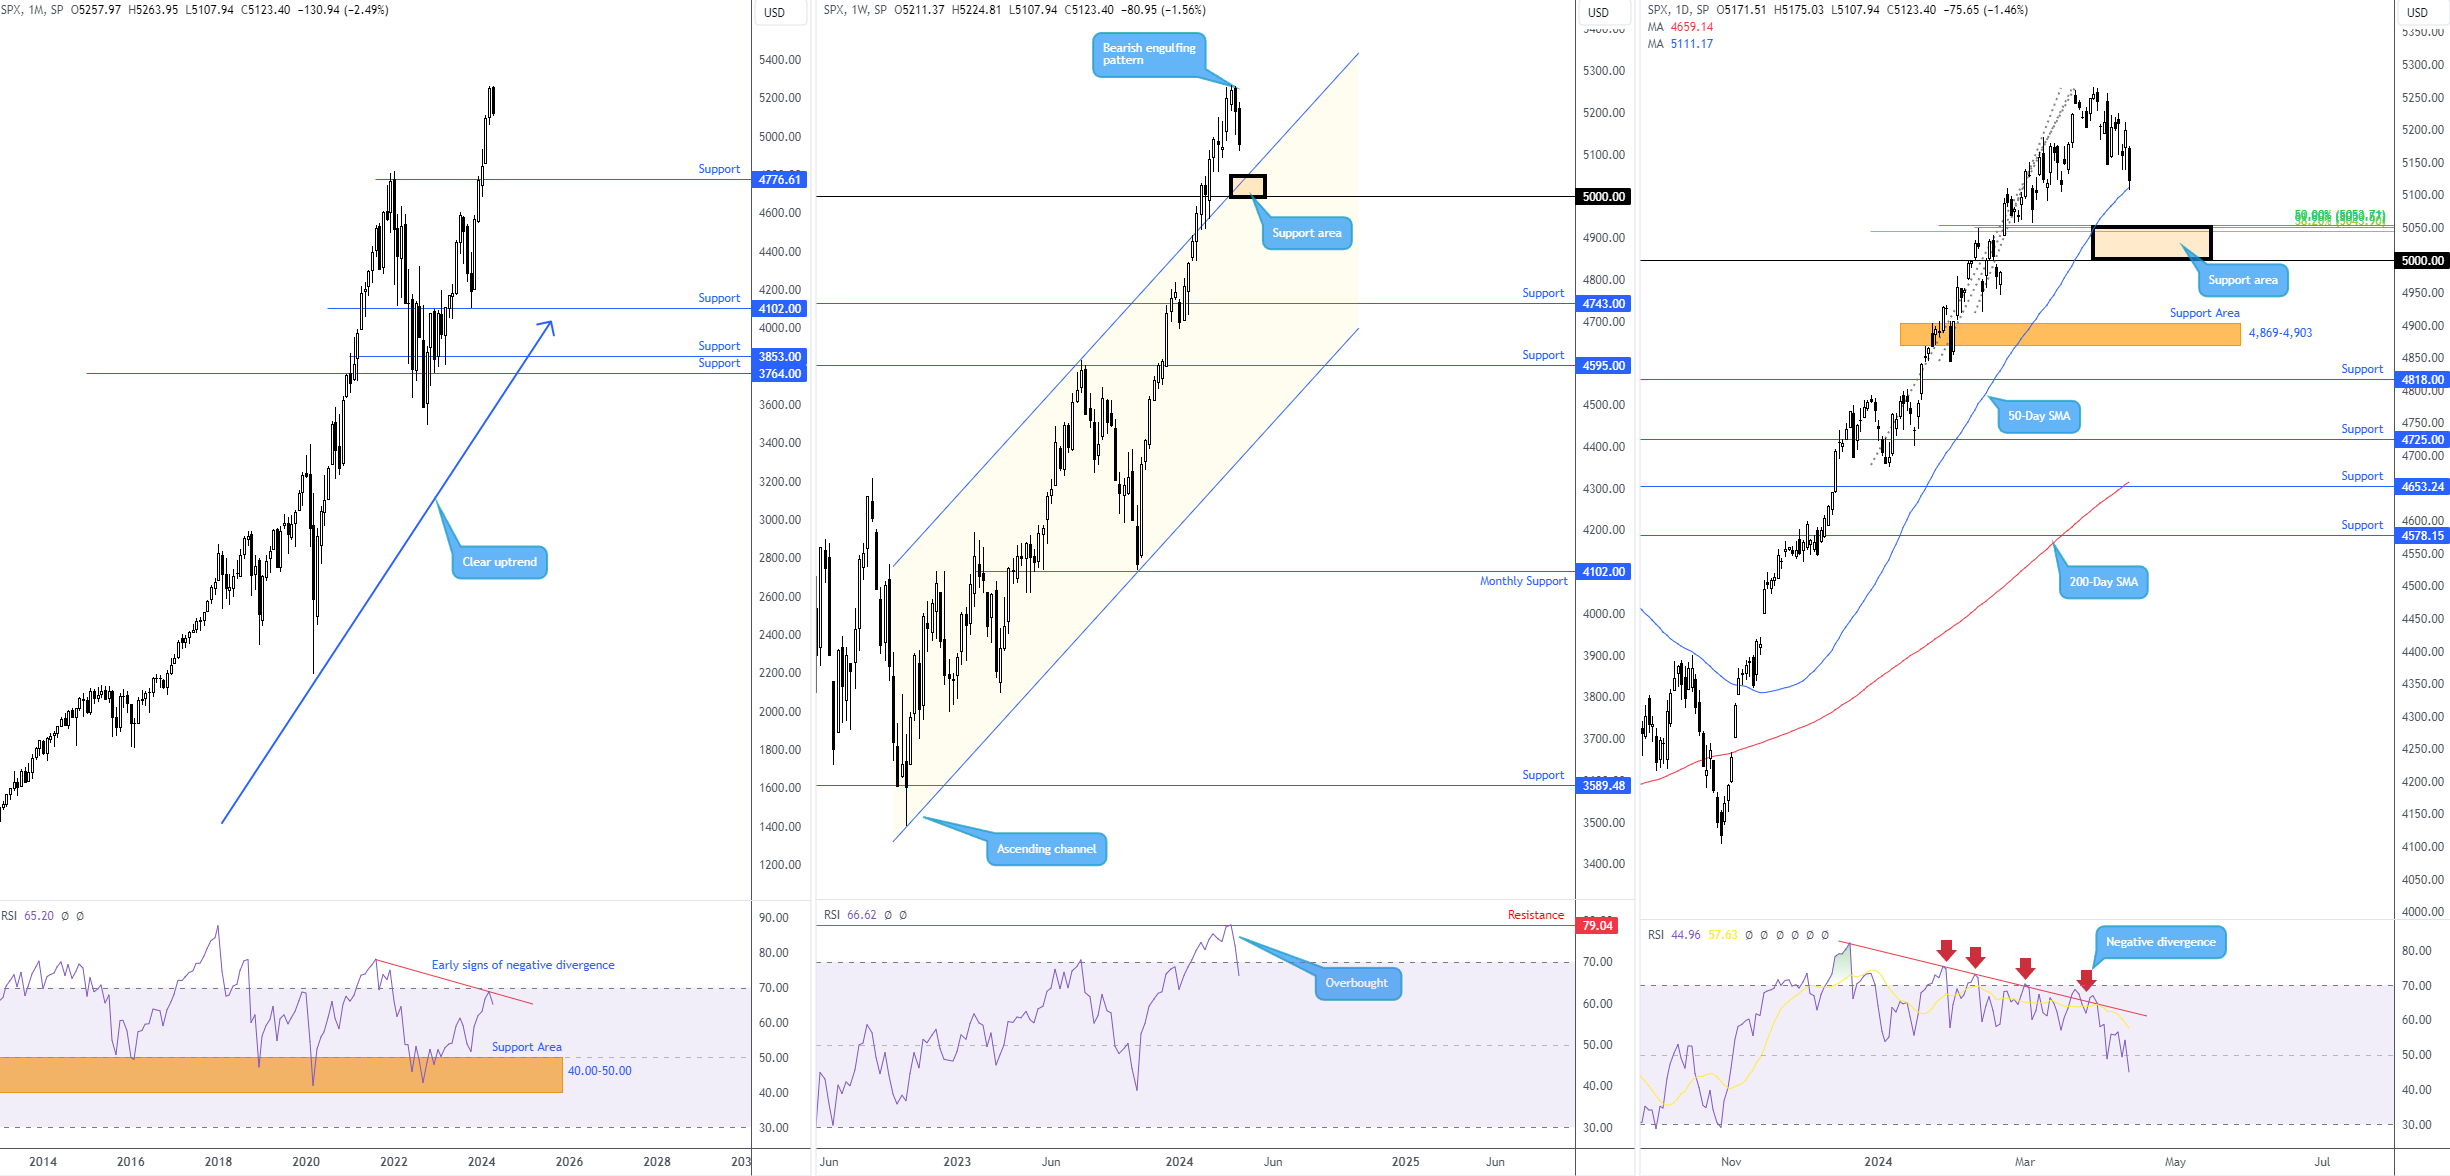
Kicking things off from the monthly chart, following last week’s all-time high of 5,264, there is plenty of scope for a deeper correction to as far south as support at 4,776. Increasing the chances of further downside on the monthly scale is the early signs of negative divergence out of the Relative Strength Index (RSI) ahead of overbought territory.

Moving across a frame to the weekly chart, the RSI also responded from indicator resistance at 79.04 (a level extended from as far back as early 2020) and recently departed from overbought space (a bearish signal for many who follow this oscillator). With respect to price action, following the prior week’s bearish engulfing pattern, last week concluded within a stone’s throw of support made up between the 5,000 level and channel resistance-turned-potential support, taken from the high of 4,607.

Meanwhile, out of the daily timeframe, Friday’s -1.5% fall led the market average to test the mettle of the 50-day simple moving average at 5,111 by the week’s end, positioned just north of a moderate Fibonacci cluster at around 5,050. Although buyers could attempt to defend the simple moving average (mean reversion strategies are likely to take profit here, for example), any rebound is unlikely to be exciting as support commands attention between the 5,000 level and the noted Fibonacci cluster.

Direction this week?

Technically, a deeper correction is likely this week until the 5,000 area, where chart studies suggest buyers could make an appearance in line with the underlying uptrend. The area between the 5,000 level and the channel resistance-turned-potential support on the weekly timeframe, as well as the Fibonacci cluster on the daily chart, is likely to be watched closely for signs of buying this week if tested.

Share: Feed news

This material on this website is intended for illustrative purposes and general information only. It does not constitute financial advice nor does it take into account your investment objectives, financial situation or particular needs. Commission, interest, platform fees, dividends, variation margin and other fees and charges may apply to financial products or services available from FP Markets. The information in this website has been prepared without taking into account your personal objectives, financial situation or needs. You should consider the information in light of your objectives, financial situation and needs before making any decision about whether to acquire or dispose of any financial product. Contracts for Difference (CFDs) are derivatives and can be risky; losses can exceed your initial payment and you must be able to meet all margin calls as soon as they are made. When trading CFDs you do not own or have any rights to the CFDs underlying assets.

FP Markets recommends that you seek independent advice from an appropriately qualified person before deciding to invest in or dispose of a derivative. A Product Disclosure Statement for each of the financial products is available from FP Markets can be obtained either from this website or on request from our offices and should be considered before entering into transactions with us. First Prudential Markets Pty Ltd (ABN 16 112 600 281, AFS Licence No. 286354).

Recommended content


Recommended content

Editors’ Picks

AUD/USD regains the constructive outlook above the 200-day SMA

AUD/USD regains the constructive outlook above the 200-day SMA

AUD/USD advanced strongly for the second session in a row, this time extending the recovery to the upper 0.6500s and shifting its focus to the weekly highs in the 0.6580-0.6585 band, an area coincident with the 100-day SMA.

AUD/USD News

EUR/USD recovers to top end of consolidation ahead of Friday’s US NFP

EUR/USD recovers to top end of consolidation ahead of Friday’s US NFP

EUR/USD drove back to the top end of recent consolidation on Thursday, recovering chart territory north of the 1.0700 handle as market risk appetite regains balance heading into another US Nonfarm Payrolls Friday.

EUR/USD News

Gold price pullback on Fed hawkish tilt amidst lower US yields, weaker US Dollar

Gold price pullback on Fed hawkish tilt amidst lower US yields, weaker US Dollar

Gold price clings to the $2,300 figure in the mid-North American session on Thursday amid an upbeat market sentiment, falling US Treasury yields, and a softer US Dollar. Traders are still digesting Wednesday’s Federal Reserve decision to hold rates unchanged.

Gold News

Bitcoin price rises 5% as BlackRock anticipates a new wave of capital inflows into BTC ETFs from investors

Bitcoin price rises 5% as BlackRock anticipates a new wave of capital inflows into BTC ETFs from investors

Bitcoin (BTC) price slid to the depths of $56,552 on Wednesday as the cryptocurrency market tried to front run the Federal Open Market Committee (FOMC) meeting. The flash crash saw millions in positions get liquidated.

Read more

FOMC in the rear-view mirror – NFP eyed

FOMC in the rear-view mirror – NFP eyed

The update from May’s FOMC rate announcement proved more dovish than expected, which naturally weighed on the US dollar (sending the DXY to lows of 105.44) and US yields, as well as, initially at least, underpinning major US equity indices.

Read more

Forex MAJORS

Cryptocurrencies

Signatures