S&P 500 News: Index opens higher as focus turns to Nvidia earnings, Jackson Hole
- S&P 500 lost 2.11% last week, bringing the August decline to 4.8%
- S&P 500 index broke below the 50-day SMA last week.
- Nvidia’s quarterly earnings, out on Wednesday, are the most-watched equity market event of the week.
- Fed Chair Jay Powell will give keynote address at Jackson Hole event on Friday.
- S&P Global Manufacturing and Services PMIs released on Wednesday.

The S&P 500 has surprisingly opened higher on Monday despite negative headlines out of China. The Chinese central bank cut several important interest rates just one week after doing so on August 14. Economists had expected the People’s Bank of China (PBoC) to wait until September to raise rates, but a sluggish post-covid economy and reeling real estate industry seem to have forced policymakers’ hand.
Instead, the market is rather upbeat about two specific events this week. First, Nvidia (NVDA) will release its second-quarter results in the post-market on Wednesday, which analysts have unanimously revised upwards. Then on Friday, Federal Reserve Chair Jerome Powell will give the keynote address at the Kansas City Fed’s Economic Policy Symposium in Jackson Hole, Wyoming, on Friday.
At the time of writing, the S&P 500 has advanced 0.5%, while the NASDAQ Composite has gained 1%, and the Dow is ever so slightly in the red.
S&P 500 News: Nvidia earnings
All 33 Wall Street analysts covering Nvidia have revised their earnings forecast higher over the past 30 days for Nvidia’s Q2 results. The consensus for adjusted earnings per share (EPS) is now $2.09. The sales consensus for the quarter is $11.07 billion, slightly higher than Nvidia’s earlier outlook for $11 billion.
Despite already trading up more than 200% year to date, fervor for this chip designer keeps growing. Demand for its leading-edge chips used in large artificial intelligence platforms and systems has raised the hype behind the share price.
On Monday, HSBC analyst Franke Lee raised his price target on NVDA stock from $600 (already 33% above the current price) to $780. Lee’s view is that there is plenty of likelihood that the earnings outlook for next year will rise substantially from here, giving Nvidia a much lower forward price multiple. Nvidia’s rally this spring began when management hiked its outlook on Q2 revenues by $4 billion, so there is some precedent to that idea.
KeyBanc analyst John Vinh also raised his price target to $620, arguing that Nvidia plays in a league of its own and that its CUDA software platform has given it a particularly competitive perch outside of its AI-focused hardware business.
Powell expected to raise spectre of longer period of high interest rates
Fed Chair Powell’s speech on Friday morning, coming in the middle of the three-day Jackson Hole event, is thought to be the most significant event of the week. Of course, everyone seems to think that Powell will once again reiterate his many statements that the US central bank will need to keep interest rates “higher for longer”.
However, sly observers will pounce on any suggestion of a further rate increase. Many in the market already think the central bank is finished with its hiking cycle but just has not admitted it in a bid to keep the stock market from engaging in another optimistic rally that could result in further inflationary pressure.
There is an 87% chance of no change in interest rates at the September Fed policy meeting and a 60% chance that rates remain here at the current range of 5.25% to 5.5% in November, according to the CME Group’s FedWatch Tool. Goldman Sachs analysts think a rate cut will fail to emerge until the May 2024 meeting, about 10 months after the most recent hike in July.
Both Consumer Price Index (CPI) and Personal Consumption Expenditures (PCE) core inflation have been slowing down steadily for the past year. Fed governors, however, have been wary that rising oil prices could reinvigorate inflationary impulses.
Economic indicators that may also color the Fed Chair’s speech are Wednesday’s S&P Global Manufacturing and Services PMIs (Purchasing Managers’ Index) and Thursday’s Durable Goods Orders. Market consensus has the August Manufacturing PMI improving by 40 basis points to 49.4 and the Services PMI remaining flat at 52.3. July Durable Goods Orders are expected to arrive at -4% compared with June’s 4.6%.
S&P 500 FAQs
What is the S&P 500?
The S&P 500 is a widely followed stock price index which measures the performance of 500 publicly owned companies, and is seen as a broad measure of the US stock market. Each company’s influence on the computation of the index is weighted based on market capitalization. This is calculated by multiplying the number of publicly traded shares of the company by the share price. The S&P 500 index has achieved impressive returns – $1.00 invested in 1970 would have yielded a return of almost $192.00 in 2022. The average annual return since its inception in 1957 has been 11.9%.
How are companies chosen to be included in the S&P 500?
Companies are selected by committee, unlike some other indexes where they are included based on set rules. Still, they must meet certain eligibility criteria, the most important of which is market capitalization, which must be greater than or equal to $12.7 billion. Other criteria include liquidity, domicile, public float, sector, financial viability, length of time publicly traded, and representation of the industries in the economy of the United States. The nine largest companies in the index account for 27.8% of the market capitalization of the index.
How can I trade the S&P 500?
There are a number of ways to trade the S&P 500. Most retail brokers and spread betting platforms allow traders to use Contracts for Difference (CFD) to place bets on the direction of the price. In addition, that can buy into Index, Mutual and Exchange Traded Funds (ETF) that track the price of the S&P 500. The most liquid of the ETFs is State Street Corporation’s SPY. The Chicago Mercantile Exchange (CME) offers futures contracts in the index and the Chicago Board of Options (CMOE) offers options as well as ETFs, inverse ETFs and leveraged ETFs.
What factors drive the S&P 500?
Many different factors drive the S&P 500 but mainly it is the aggregate performance of the component companies revealed in their quarterly and annual company earnings reports. US and global macroeconomic data also contributes as it impacts on investor sentiment, which if positive drives gains. The level of interest rates, set by the Federal Reserve (Fed), also influences the S&P 500 as it affects the cost of credit, on which many corporations are heavily reliant. Therefore, inflation can be a major driver as well as other metrics which impact the Fed decisions.
Earnings of the week
Monday, August 21 - Zoom Video (ZM)
Tuesday, August 22 - Lowe's (LOW), DICK'S Sporting Goods (DKS), Baidu (BIDU), Medtronic (MDT), Toll Brothers (TOL).
Wednesday, August 23 - Nvidia (NVDA), Analog Devices (ADI), Snowflake (SNOW), Autodesk (ADSK), Splunk (SPLK), and Foot Locker (FL)
Thursday, August 24 - Intuit (INTU), NetEase (NTES), Workday (WDAY), Ulta Beauty (ULTA), Affirm (AFRM), Marvell Technology (MRVL)
What they said about the market – BTIG
Financial services firm BTIG said that buying the dip in the S&P 500 is no longer as appealing since the index has appreciated to a decent level in 2023.
"Ultimately, we still see the downside risks outweighing the upside reward and while there are likely to be bounces along the way, we see little reason to jump in here given momentum in tech and other high-beta areas has just started to rollover after breaking key support."
S&P 500 forecast
The S&P 500 broke below the 50-day Simple Moving Average (SMA) last week and, by this week, has created quite a gap to regain it. The index has not traded below that SMA since it broke above here on March 29.
Traders should expect to see the index at least move to the 100-day SMA – near 4,300 at the time of writing. That support level would make sense as well since it sits between support at 4,325 and the top of the earlier resistance band of 4,200. The S&P 500 is already trading at 34 on the Relative Strength Index (RSI).
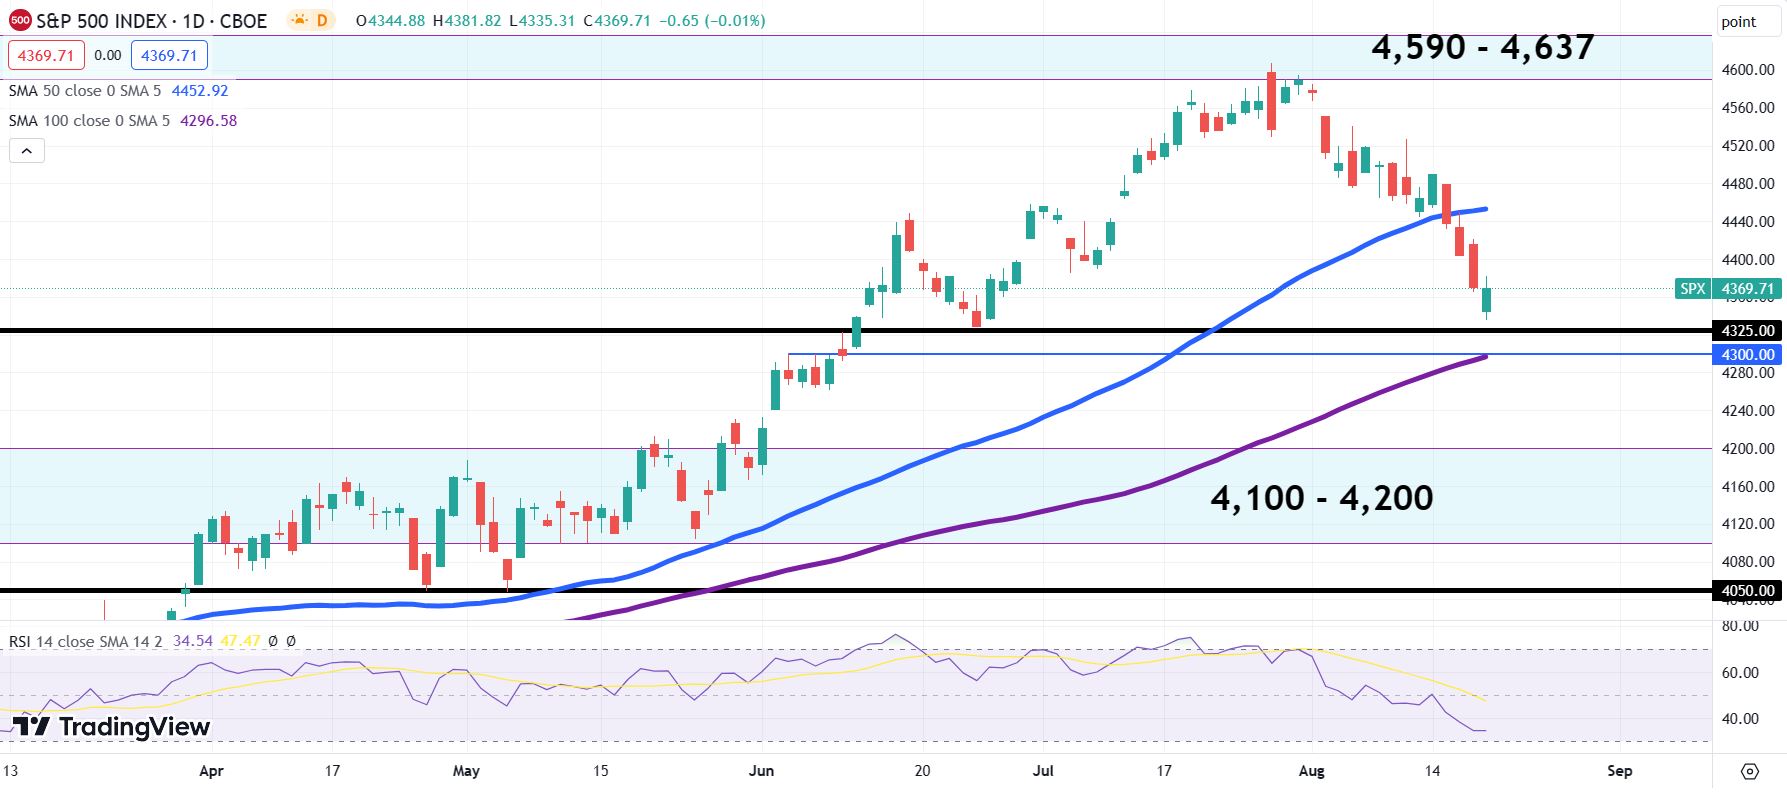
S&P 500 daily chart
Despite the fact that the RSI appears to be nearing “oversold” status on the daily RSI, the weekly RSI on the weekly chart below offers a reading of 55. That means it still trades above the midpoint. If the sell-off continues, then the index could have quite a ways to fall.
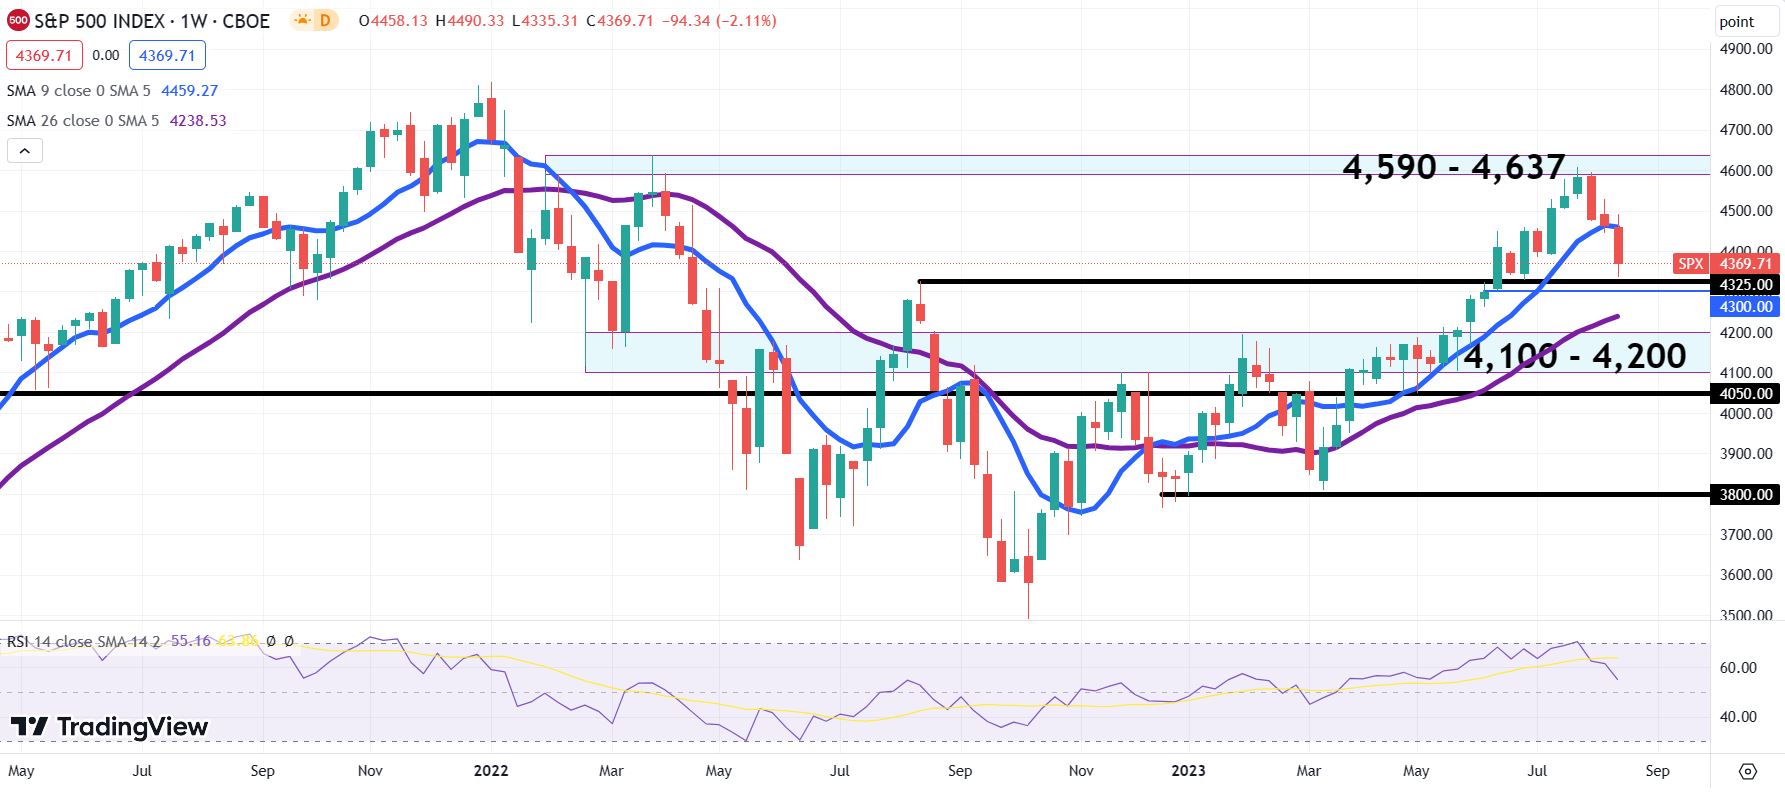
S&P 500 weekly chart
Premium
You have reached your limit of 3 free articles for this month.
Start your subscription and get access to all our original articles.
Author

Clay Webster
FXStreet
Clay Webster grew up in the US outside Buffalo, New York and Lancaster, Pennsylvania. He began investing after college following the 2008 financial crisis.


