S&P 500 Forecast: As index breaks below price channel for first time in six months, expect more pain to come
- S&P 500 loses 0.21% on Tuesday after plunging below bottom trendline on Monday.
- Index should continue trending south to the 4,818 support level.
- Bitcoin halving, Israeli tensions threaten to force a market correction.
- Sticky inflation and robust economy has market postponing first rate cut until September.

The S&P 500 appears to have sprung a leak this week. In the prior week, the index was seen pulling back in light of reduced expectations for a Federal Reserve (Fed) interest rate cut, but Monday of this week saw a clear break and close below the bottom trendline of the price channel that has been in place since October 2023.
The index floundered 0.21% on Tuesday following Monday's 1.2% sell-off and last Friday's 1.46% decline. US Treasury yields once again rose more than 1% between the 2-year and 30-year tenures. The 2-year ended the day at 5%, back at a level it left in November of last year.
S&P 500 news: Index faces worries over Middle East, BTC halving, hot Retail Sales
Several narratives are coinciding in such a way over the past week to render the stock market toxic at a time when analysts are becoming increasingly bullish on the S&P 500.
These narratives comprise a reduction in expectations for the Fed to cut interest rates in the near-term environment, expanding possibilities in a regional war engulfing the Middle East, and Bitcoin’s upcoming halving event that could refocus equity bulls on the crypto market in the short term.
First, Retail Sales on Monday rose 0.7% in March on a monthly basis. This was below the previous month’s 0.9% rate but well above the 0.3% expectation. These higher numbers show an economy that is far from weak, and traders see the robust data as a sign that inflation is unlikely to buckle to the 2% core target that is required by the Fed.
Last week’s Consumer Price Index (CPI) data did not oblige those in the market that had hoped a lower reading would present the central bank with reason enough to cut interest rates by July. CME Group’s FedWatch Tool now expects the central bank won’t cut rates until September.
This has pushed up US Treasury yields, which typically are inverted to equity market indices.
Then there’s the ongoing situation in Israel. After the country, which has been at war with Hamas since last October, bombed an Iranian consulate in defiance of international law, the Iranian regime pre-announced an air attack on Israeli military assets over the weekend.
While Iran said its aggression was finished, and US officials have attempted to rein in further Israeli outbursts, Israel has continued its saber-rattling this week. Rumors have surfaced that an Israeli plan is now in place to further attack Iranian assets. The market is worried that this aggression could spill over into a full-fledged regional war that forces Oil price to skyrocket.
Then there’s the Bitcoin angle. The fourth Bitcoin halving is now upon us. Scheduled to take place on either April 19 or 20, the event is when Bitcoin mining rewards are cut in half from 6.25 BTC per block to 3.125. In the past, every halving event has led to a steep rise in the value of Bitcoin as BTC becomes more scarce since the mining of it grows more expensive.
Expect a large number of equity traders to refocus on the crypto market over the next several weeks since BTC ETFs have made it easier for traders to move between asset classes.
S&P 500 FAQs
The S&P 500 is a widely followed stock price index which measures the performance of 500 publicly owned companies, and is seen as a broad measure of the US stock market. Each company’s influence on the computation of the index is weighted based on market capitalization. This is calculated by multiplying the number of publicly traded shares of the company by the share price. The S&P 500 index has achieved impressive returns – $1.00 invested in 1970 would have yielded a return of almost $192.00 in 2022. The average annual return since its inception in 1957 has been 11.9%.
Companies are selected by committee, unlike some other indexes where they are included based on set rules. Still, they must meet certain eligibility criteria, the most important of which is market capitalization, which must be greater than or equal to $12.7 billion. Other criteria include liquidity, domicile, public float, sector, financial viability, length of time publicly traded, and representation of the industries in the economy of the United States. The nine largest companies in the index account for 27.8% of the market capitalization of the index.
There are a number of ways to trade the S&P 500. Most retail brokers and spread betting platforms allow traders to use Contracts for Difference (CFD) to place bets on the direction of the price. In addition, that can buy into Index, Mutual and Exchange Traded Funds (ETF) that track the price of the S&P 500. The most liquid of the ETFs is State Street Corporation’s SPY. The Chicago Mercantile Exchange (CME) offers futures contracts in the index and the Chicago Board of Options (CMOE) offers options as well as ETFs, inverse ETFs and leveraged ETFs.
Many different factors drive the S&P 500 but mainly it is the aggregate performance of the component companies revealed in their quarterly and annual company earnings reports. US and global macroeconomic data also contributes as it impacts on investor sentiment, which if positive drives gains. The level of interest rates, set by the Federal Reserve (Fed), also influences the S&P 500 as it affects the cost of credit, on which many corporations are heavily reliant. Therefore, inflation can be a major driver as well as other metrics which impact the Fed decisions.
S&P 500 forecast
The S&P 500 index broke and closed below the bottom trendline on Monday. This trendline was drawn in parallel to the top trendline, which has more historic retests over the past six months. The price channel began in October of 2023, and represents the steady accumulation trade that the market has witnessed since then.
Monday's break and Tuesday's continued decline foreshadows a period of pushback. The S&P 500 is likely to continue stalling or trending down until the index reaches the 4,818 level. That resistance level was at one time the all-time high in December 2021 before resurrecting as resistance once again in January of this year.
The 9-day Simple Moving Average has broken below its 20-day counterpart, confirming that this pullback has legs. Expect this price level to come into view especially quickly if either Iran or Israel ramp up their military activities.
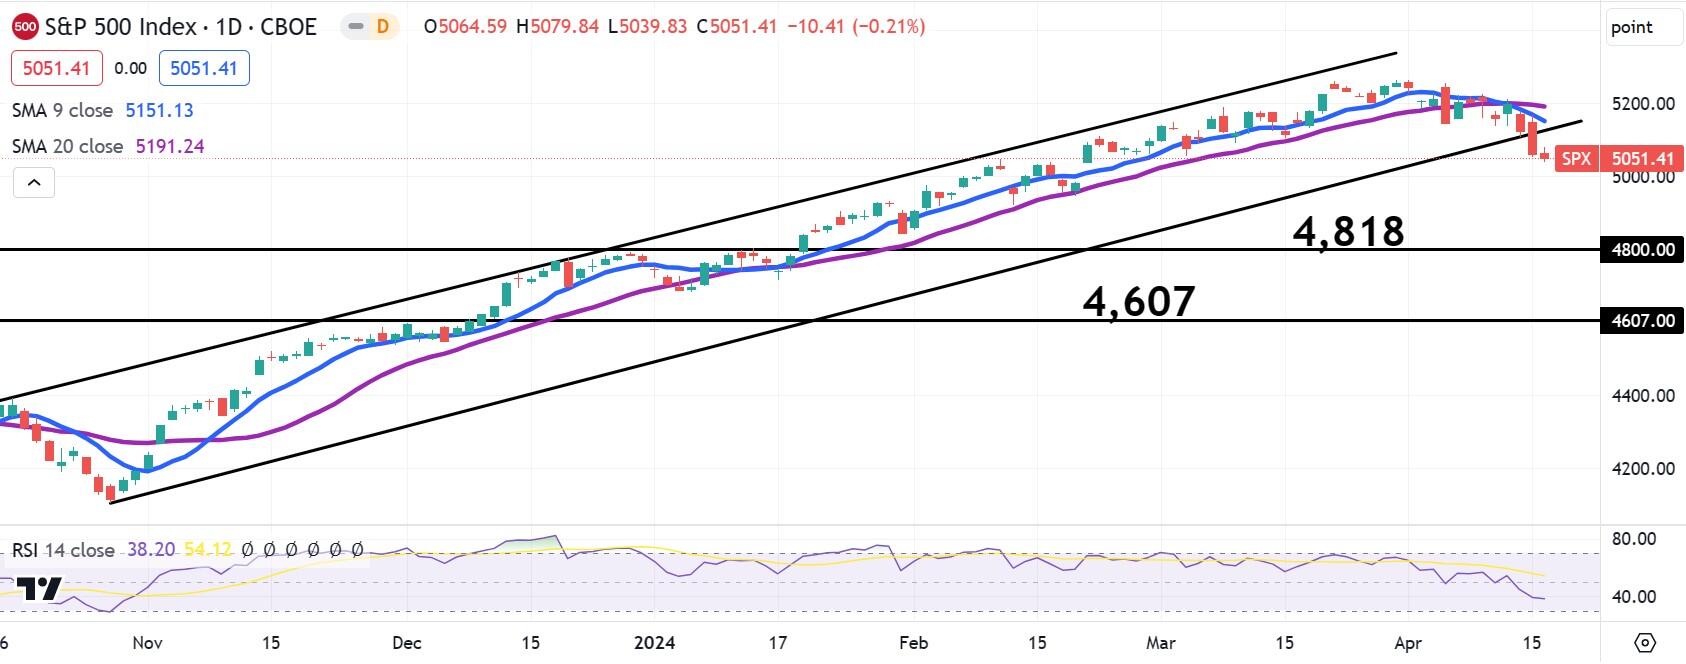
S&P 500 daily chart
Premium
You have reached your limit of 3 free articles for this month.
Start your subscription and get access to all our original articles.
Author

Clay Webster
FXStreet
Clay Webster grew up in the US outside Buffalo, New York and Lancaster, Pennsylvania. He began investing after college following the 2008 financial crisis.


