S&P 500 Forecast: Index extends decline as risk-off mood persists
- S&P 500 dropped 0.74% last week, its fourth consecutive loss.
- Equity index stayed uncertain and closed flat on Monday.
- Tuesday begins with index shedding ground once more as 4,300 turns into resistance.
- On Wednesday, the US ISM Services PMI is expected to show a still expanding service sector.
- Constellation Brands, Conagra Brands, Levi Strauss report earnings on Thursday.

The S&P 500 index lost 0.74% last week, which was the fourth week in a row where the index declined. That performance came despite Personal Consumption Expenditures (PCE) data showing that Core inflation was growing at its slowest pace in two years.
On Monday, the S&P 500 was volatile but closed largely flat on the day. News that Tesla (TSLA) witnessed declining deliveries and production in the third quarter led automaker stocks lower. US automakers were already in a depressed state due to the ongoing United Auto Workers (UAW) strike. The strike spread to General Motors' (GM) Lansing Delta Township assembly plant – where it produces the Buick Enclave and Chevrolet Traverse – and Ford's (F) Chicago factory – where it produces the Ford Explorer, Police Interceptor and Lincoln Aviator – last Friday.
This week the S&P 500’s performance will largely hinge on the data front as well as yields in the US Treasury market. The US ISM Services PMI arrives on Wednesday, and this report will be followed on Friday by the Nonfarm Payrolls (NFP) reading for September on Friday. Due to a number of positive data releases on Monday, positive readings are roundly expected for the rest of the week.
The S&P 500, NASDAQ Composite and Dow Jones Industrial Average all opened lower on Tuesday as US Treasury yields continued to soar. The 30-year Treasury now yields 4.85%, while the 3-month Treasury yields above 5.5%.
S&P 500 News: Week starts off with data beats for manufacturing
On Monday, the Institute of Supply Management (ISM) reported better readings than expected for US manufacturing. The ISM Manufacturing Purchasing Managers Index (PMI) for September led with a reading of 49, well above the expected 47.7. This corresponded well with the S&P Global Manufacturing PMI, announced on the same day, which also showed a much better reading than expected. Still, both reports showed a marginally contracting manufacturing sector.
The tea leaves appear to show a manufacturing sector that may be in expansion soon enough. The ISM Manufacturing Employment Index jumped from August’s reading of 48.5 to 51.2 in September. Likewise, the ISM Manufacturing New Orders Index advanced from August’s result, 46.8, to September’s 49.2. Readings below 50 constitute contractions, but the data is based on surveys of purchasing managers’ sentiment for the future.
At 14:00 GMT on Wednesday, the services sector counterpart to Monday’s data arrives. The ISM Services PMI is expected to show an expansion in the US index at 53.6. This would be lower than August’s 54.5 reading but would still demonstrate an overall expansion.
With US student loan payments resuming this month, economists predict that lower consumer spending will reduce the service sector economy in the US, but that may take several months to be seen in the data.
September Nonfarm Payrolls will highlight whether employment is softening
By far the most significant data release of the week will be the September Nonfarm Payrolls on Friday. Analysts have given a consensus forecast for 170K new hires in the previous month, a pullback from August’s 187K.
It would be unsurprising if the August figure is revised lower, however. Both June and July’s data was revised lower after initially much higher readings. June’s initial reading showed 209K net new hires but was later revised all the way down to 105K. July’s initial 187K reading was revised down to 157K.
These revisions are largely in line with what the market wants to see. The 0.1% Core inflation growth in August seen in last week’s PCE data confirms that recent higher prices are mostly just a product of geopolitical tensions with OPEC+. The latter, led by Russia and Saudi Arabia, has reduced supply to keep oil prices near $90 a barrel.
Even ADP’s September Employment Change data, out on Wednesday, is calling for a slowing labor market. Analysts predict ADP will release a 153K figure, which is down from August’s 177K print.
A slowing labor market and reduced inflation should mean less likelihood of further Federal Reserve (Fed) rate hikes. The CME Group’s FedWatch Tool gives a 74% chance that the central bank will keep rates unchanged at its November 1 meeting. This was at 84% just one week ago, but it was also given a 65% chance one month ago.
Earnings of the week
Tuesday, October 3 - McCormick (MKC), Cal-Maine Foods (CALM)
Wednesday, October 4 - Helen of Troy (HELE), Tilray Brands (TLRY)
Thursday, October 5 - Constellation Brands (STZ), Conagra Brands (CAG), and Levi Strauss (LEVI)
What they said about the market – Bank of America Securities
Bank of America Securities released a note early Monday arguing in favor of a year-end rally. The rising 40-week Simple Moving Average (SMA) near 4,200 represents a “cyclical bull market”, according to the bank.
“We think 2023 is like other bullish turns in 2020 (COVID-19), 2019 (China trade war), 2016 (Brexit and Trump elected) and 2012 (Eurozone crisis). Corrections from summer peaks into November 2012, November 2016 and October 2019 tested/undercut the rising 40-week MA and preceded year-end rallies in those years. The late 2023 setup resembles those from late 2012, late 2016 and late 2019. This suggests that a test or undercut of the 40-week MA could precede a year end rally.”
S&P 500 FAQs
What is the S&P 500?
The S&P 500 is a widely followed stock price index which measures the performance of 500 publicly owned companies, and is seen as a broad measure of the US stock market. Each company’s influence on the computation of the index is weighted based on market capitalization. This is calculated by multiplying the number of publicly traded shares of the company by the share price. The S&P 500 index has achieved impressive returns – $1.00 invested in 1970 would have yielded a return of almost $192.00 in 2022. The average annual return since its inception in 1957 has been 11.9%.
How are companies chosen to be included in the S&P 500?
Companies are selected by committee, unlike some other indexes where they are included based on set rules. Still, they must meet certain eligibility criteria, the most important of which is market capitalization, which must be greater than or equal to $12.7 billion. Other criteria include liquidity, domicile, public float, sector, financial viability, length of time publicly traded, and representation of the industries in the economy of the United States. The nine largest companies in the index account for 27.8% of the market capitalization of the index.
How can I trade the S&P 500?
There are a number of ways to trade the S&P 500. Most retail brokers and spread betting platforms allow traders to use Contracts for Difference (CFD) to place bets on the direction of the price. In addition, that can buy into Index, Mutual and Exchange Traded Funds (ETF) that track the price of the S&P 500. The most liquid of the ETFs is State Street Corporation’s SPY. The Chicago Mercantile Exchange (CME) offers futures contracts in the index and the Chicago Board of Options (CMOE) offers options as well as ETFs, inverse ETFs and leveraged ETFs.
What factors drive the S&P 500?
Many different factors drive the S&P 500 but mainly it is the aggregate performance of the component companies revealed in their quarterly and annual company earnings reports. US and global macroeconomic data also contributes as it impacts on investor sentiment, which if positive drives gains. The level of interest rates, set by the Federal Reserve (Fed), also influences the S&P 500 as it affects the cost of credit, on which many corporations are heavily reliant. Therefore, inflation can be a major driver as well as other metrics which impact the Fed decisions.
S&P 500 forecast
The S&P 500 index only crashed through the 4,300 support level about one week back, but now that level appears to have turned into resistance. On Monday, during a morning rally, the index made it to exactly 4,300 before immediately selling off.
The S&P 500 is absolutely in a downtrend and needs to close above 4,325 before anyone will begin believing that the bottom is in. The index has been trending lower since July 27, and none of the positive data releases have been enough to spur a price rebound. It appears that the Fed’s “higher for longer” narrative has caused many investors to run toward the safety of high-yielding short-term Treasuries.
Due to Monday’s failure at 4,300, expect this downtrend to continue until the S&P 500 finds a bottom within the 4,100 to 4,200 demand zone. A lot of historical volume took place in that range, and value investors are likely to start nibbling at that latitude.
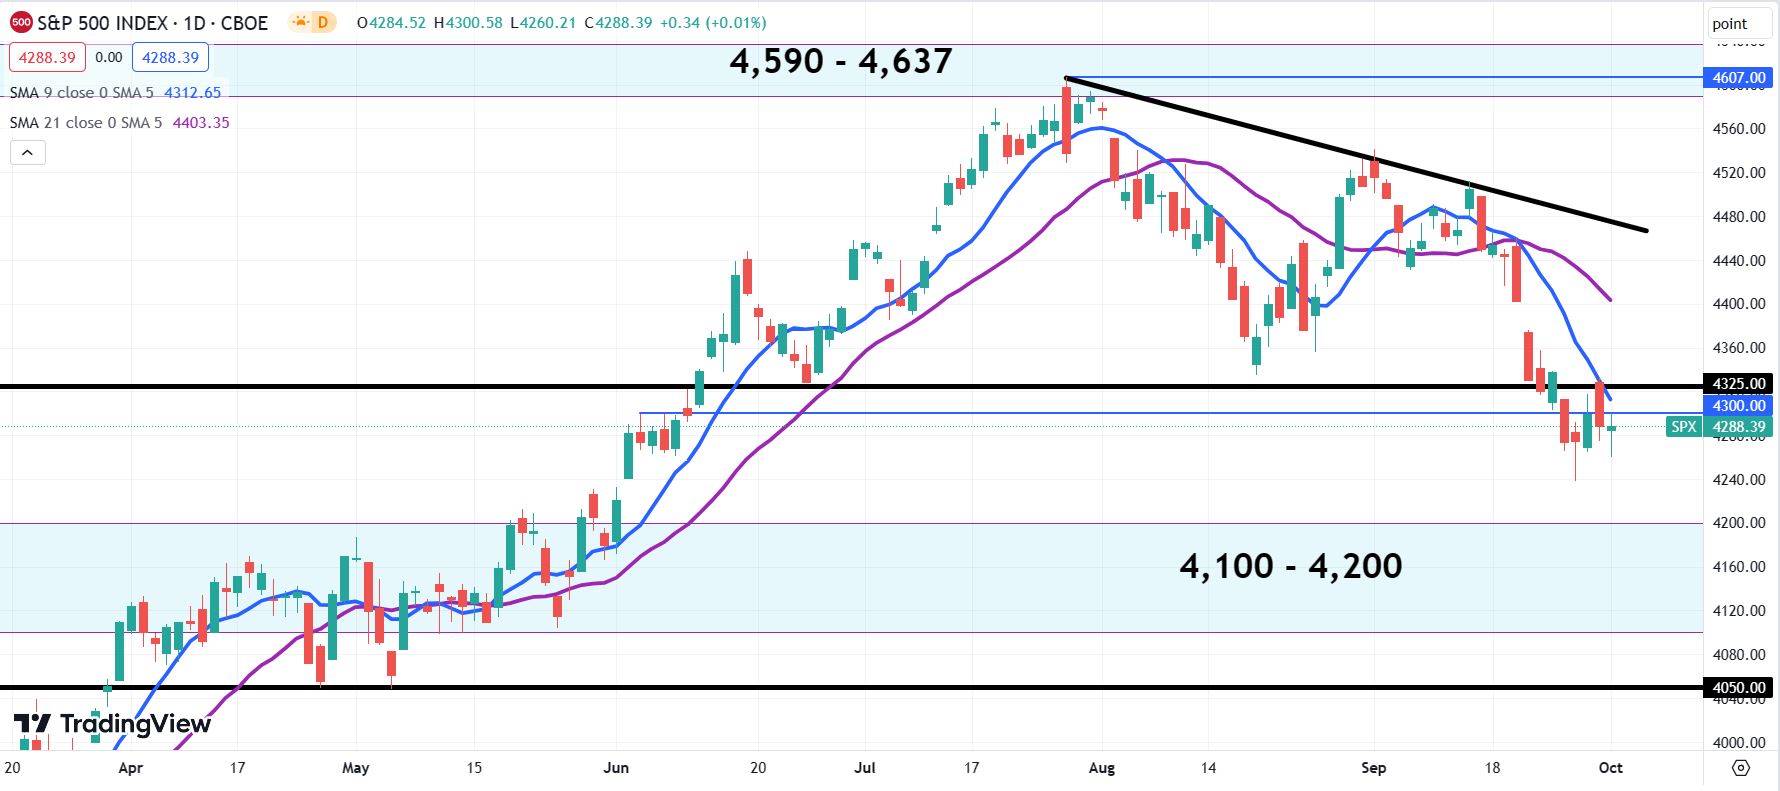
S&P 500 daily chart
Premium
You have reached your limit of 3 free articles for this month.
Start your subscription and get access to all our original articles.
Author

Clay Webster
FXStreet
Clay Webster grew up in the US outside Buffalo, New York and Lancaster, Pennsylvania. He began investing after college following the 2008 financial crisis.


