S&P 500 continues making all-time highs once again as Wall Street proffers new targets
- Evercore ISI leads Street with 6,000 year-end call on S&P 500.
- Wall Street places heavier bets on S&P 500 at 5,600 however.
- Evercore analyst says S&P 500 could reach 7,000 by end of next year.
- Nvidia becomes most valuable company in the world.

The S&P 500 produced its 30th all-time high of the year on Monday, and based on recent predictions the 2024 rally is not over yet. Tuesday has met the challenge by adding a 31st YTD all-time high, pushing the index up to 5,490.
Evercore ISI raised its price target for the S&P 500 index to a Street high of 6,000, which helped propel the index higher.
The rally is largely being led by semiconductor stocks on Tuesday, but weakness from Apple (AAPL) and Microsoft (MSFT) have left indices mixed.
S&P 500 news: The race to $4 trillion
Nvidia (NVDA) zoomed ahead of peers to become the most valuable company in the world on Tuesday. At the time of writing on Tuesday afternoon, Nvidia is worth $3.33 trillion, while Microsoft comes in second at $3.31 trillion and Apple at $3.28 trillion.
Nvidia owes its fortunes entirely to the growth in the artificial intelligence (AI) intelligence realm, but hold on, says Wedbush Securities analyst Dan Ives. In a conference speech on Tuesday, Ives said that Apple would thrust ahead to a valuation of $4 trillion within a year as it uses Apple Intelligence to own “AI in the consumer” segment.
The race to $4 trillion is becoming a common subject of debate on Wall Street of late, with various personalities believing that one of the three majors will be the first to do it before the year is out.
Evercore ISI strategist Julian Emanuel’s projection of 6,000 by year end for the S&P 500 was a major overhaul of his earlier 4,750 call. The 6,000 forecast is now the highest on Wall Street, following Goldman Sachs’ 5,600 year-end target over the weekend. Goldman is late to the party, matching UBS and BMO’s same target level.
Of course, Emanuel’s forecast heavily relies on continued optimistic headlines from the Magnificent Seven stocks, particularly semiconductors. What’s even more, Emanuel says growing profitability and multiple expansion could see the S&P 500 reach 7,000 by the end of 2025. That’s just 18 months away and would imply a 27.5% gain over that time period.
"S&P 500 6,000 by year-end on $238 EPS implies a 25x trailing PE multiple, extended on a historical basis, but well short of the 28x Y2K peak; 7,000 is possible by end-2025", wrote the Evercore ISI analyst.
Tempering this bullishness, the Wells Fargo Investment Institute releases a note on Monday saying that the 250 days following the Federal Reserve's (Fed) first interest rate cut during rate-cutting cycles on average results in a 20% decline in the index. Based on rate betting markets, the first Fed rate cut is expected this September.
S&P 500 earnings calendar
Tuesday, June 18 - KB Home (KBH)
Thursday, June 20 - Accenture (ACN), Kroger (KR), Darden Restaurants (DRI)
Friday, June 21 - CarMax (KMX)
S&P 500 FAQs
The S&P 500 is a widely followed stock price index which measures the performance of 500 publicly owned companies, and is seen as a broad measure of the US stock market. Each company’s influence on the computation of the index is weighted based on market capitalization. This is calculated by multiplying the number of publicly traded shares of the company by the share price. The S&P 500 index has achieved impressive returns – $1.00 invested in 1970 would have yielded a return of almost $192.00 in 2022. The average annual return since its inception in 1957 has been 11.9%.
Companies are selected by committee, unlike some other indexes where they are included based on set rules. Still, they must meet certain eligibility criteria, the most important of which is market capitalization, which must be greater than or equal to $12.7 billion. Other criteria include liquidity, domicile, public float, sector, financial viability, length of time publicly traded, and representation of the industries in the economy of the United States. The nine largest companies in the index account for 27.8% of the market capitalization of the index.
There are a number of ways to trade the S&P 500. Most retail brokers and spread betting platforms allow traders to use Contracts for Difference (CFD) to place bets on the direction of the price. In addition, that can buy into Index, Mutual and Exchange Traded Funds (ETF) that track the price of the S&P 500. The most liquid of the ETFs is State Street Corporation’s SPY. The Chicago Mercantile Exchange (CME) offers futures contracts in the index and the Chicago Board of Options (CMOE) offers options as well as ETFs, inverse ETFs and leveraged ETFs.
Many different factors drive the S&P 500 but mainly it is the aggregate performance of the component companies revealed in their quarterly and annual company earnings reports. US and global macroeconomic data also contributes as it impacts on investor sentiment, which if positive drives gains. The level of interest rates, set by the Federal Reserve (Fed), also influences the S&P 500 as it affects the cost of credit, on which many corporations are heavily reliant. Therefore, inflation can be a major driver as well as other metrics which impact the Fed decisions.
S&P 500 daily chart
The S&P 500 is traveling from higher high to higher high. Day after day, the index continues setting records. This is often the time when extreme bullishness can turn on a dime however.
The Relative Strength Index (RSI) is at a heightened 76 reading. For traders looking to go long, patience should allow for a reset back near the 50-day Simple Moving Average (SMA) near 5,250 or the range support at 5,200.
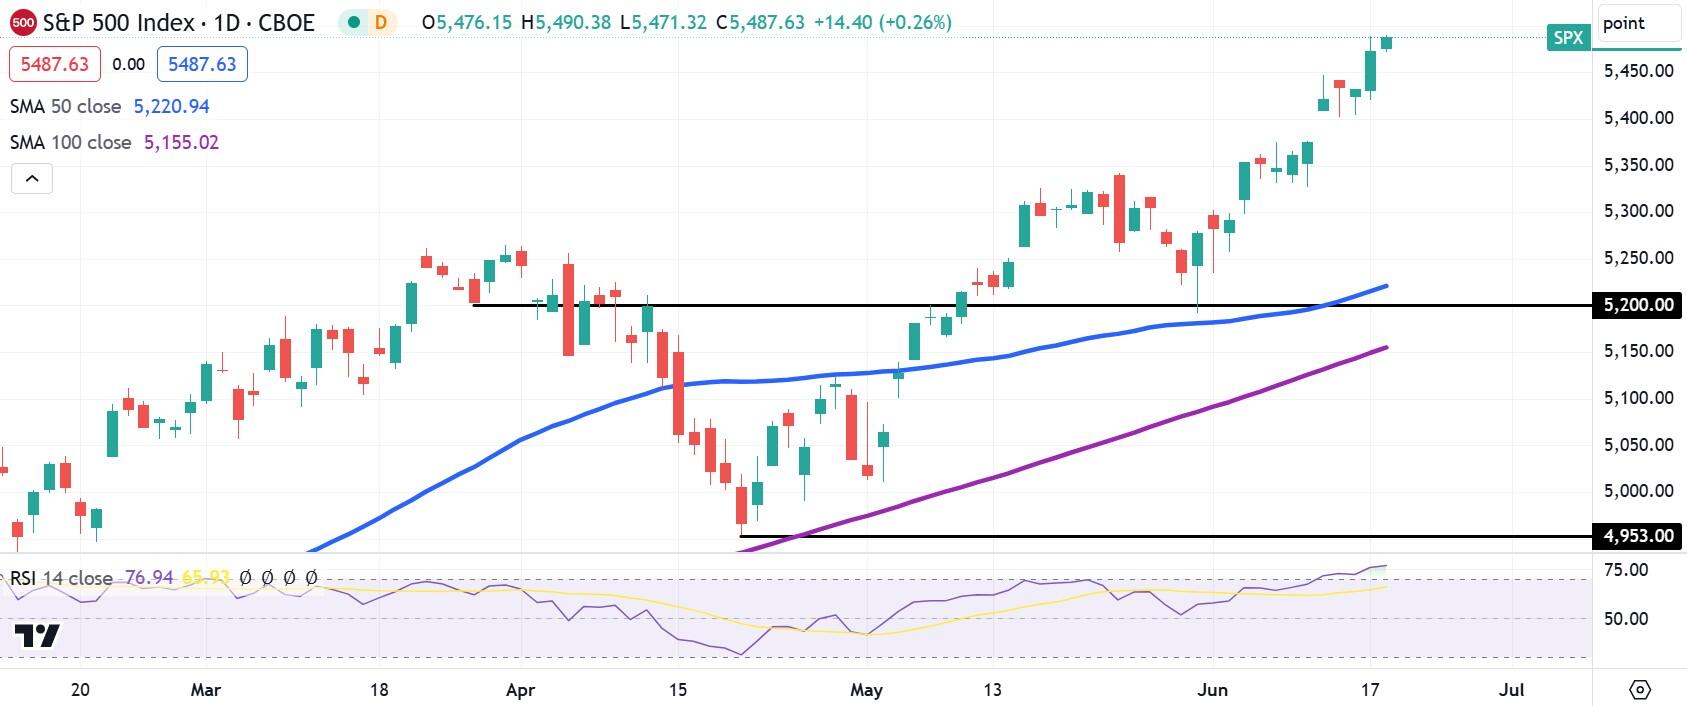
S&P 500 daily stock chart
Premium
You have reached your limit of 3 free articles for this month.
Start your subscription and get access to all our original articles.
Author

Clay Webster
FXStreet
Clay Webster grew up in the US outside Buffalo, New York and Lancaster, Pennsylvania. He began investing after college following the 2008 financial crisis.


