SKILLZ Inc Stock Price and Forecast: SKLZ gets ready to breakout but volume traffic may cap gains


  • Skillz shares have been in a long-term downtrend, which might be nearing its end.
  • SKLZ stock pops 11% on Tuesday with no apparent news flow.
  • Social media sentiment surges as does the stock.

Skillz is back on trader's minds after signalling an interesting move on Tuesday. The stock surged by nearly 12% on Tuesday, closing up at $11.77 and potentially ending a long bearish trend in place since late June. Social media commentary around the stock has picked up and so too have the underlying momentum indicators. There does not appear to be much behind the move, with little in the way of newsflow except for the retail favourite of short squeeze speculation.

Various reports are circulating that the short interest is up at 20% or more, making it a prime example for a squeeze. Whether that is the reason or not, the move was real and has continued to attract buyers, with SKLZ up another 6% at the time of writing in Wednesday's premarket. 

Skillz Inc key statistics

Market Cap $4.75 billion
Enterprise Value $7.7 billion
Price/Earnings (P/E)  

Price/Book

69
Price/Sales 17
Gross Margin 0.9
Net Margin -0.73
EBITDA TTM -$-144 million TTM
52 week low $10.06
52 week high $46.298
Average Wall Street rating and price target

BUY $18

SKLZ stock forecast

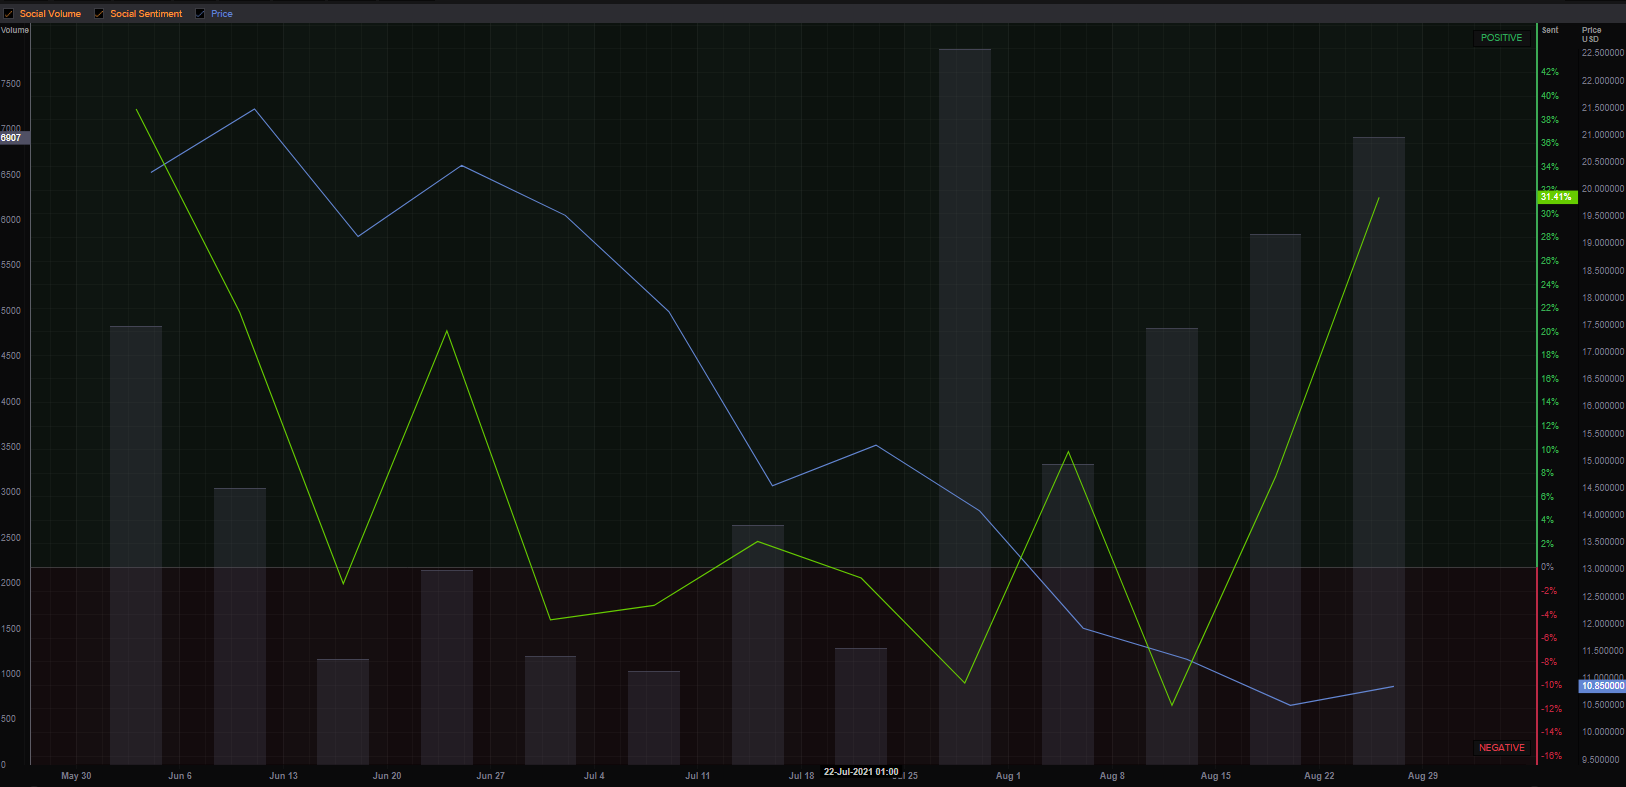
Social media sentiment, provided by Refinitiv, shows an increasing volume of comments and increasingly bullish sentiment recently in advance of the spike seen on Tuesday. Is it a useful leading indicator? The correlation with the SKLZ share price has been running quite high since May, but it is far from perfect so, as always, treat this like any other information. Useful but not a clear-cut decision-making tool. 

Looking at the chart, we can see peak SKLZ occurred during peak retail or r/wallstreetbets mania back in the early part of 2021. SKLZ peaked at over $46 and has been steadily declining since then. There have been some rebounds but, overall, the big picture trend is still negative so just be aware of that.

Tuesday's spike has taken SKLZ stock up to the 21-day moving average at $11.73. This is the first resistance to break and current indications in Wednesday's premarket are good with SKLZ adding another 6% to trade at $12.57. Breaking above the 21-day turns the short-term trend bullish and the momentum indicators are looking to move higher to confirm this breakout. The Relative Strength Index (RSI) was oversold in mid-August but has now picked up and is about to get above 50. The Moving Average Convergence Divergence (MACD) has also turned higher and crossed into bullish territory on August 23. 

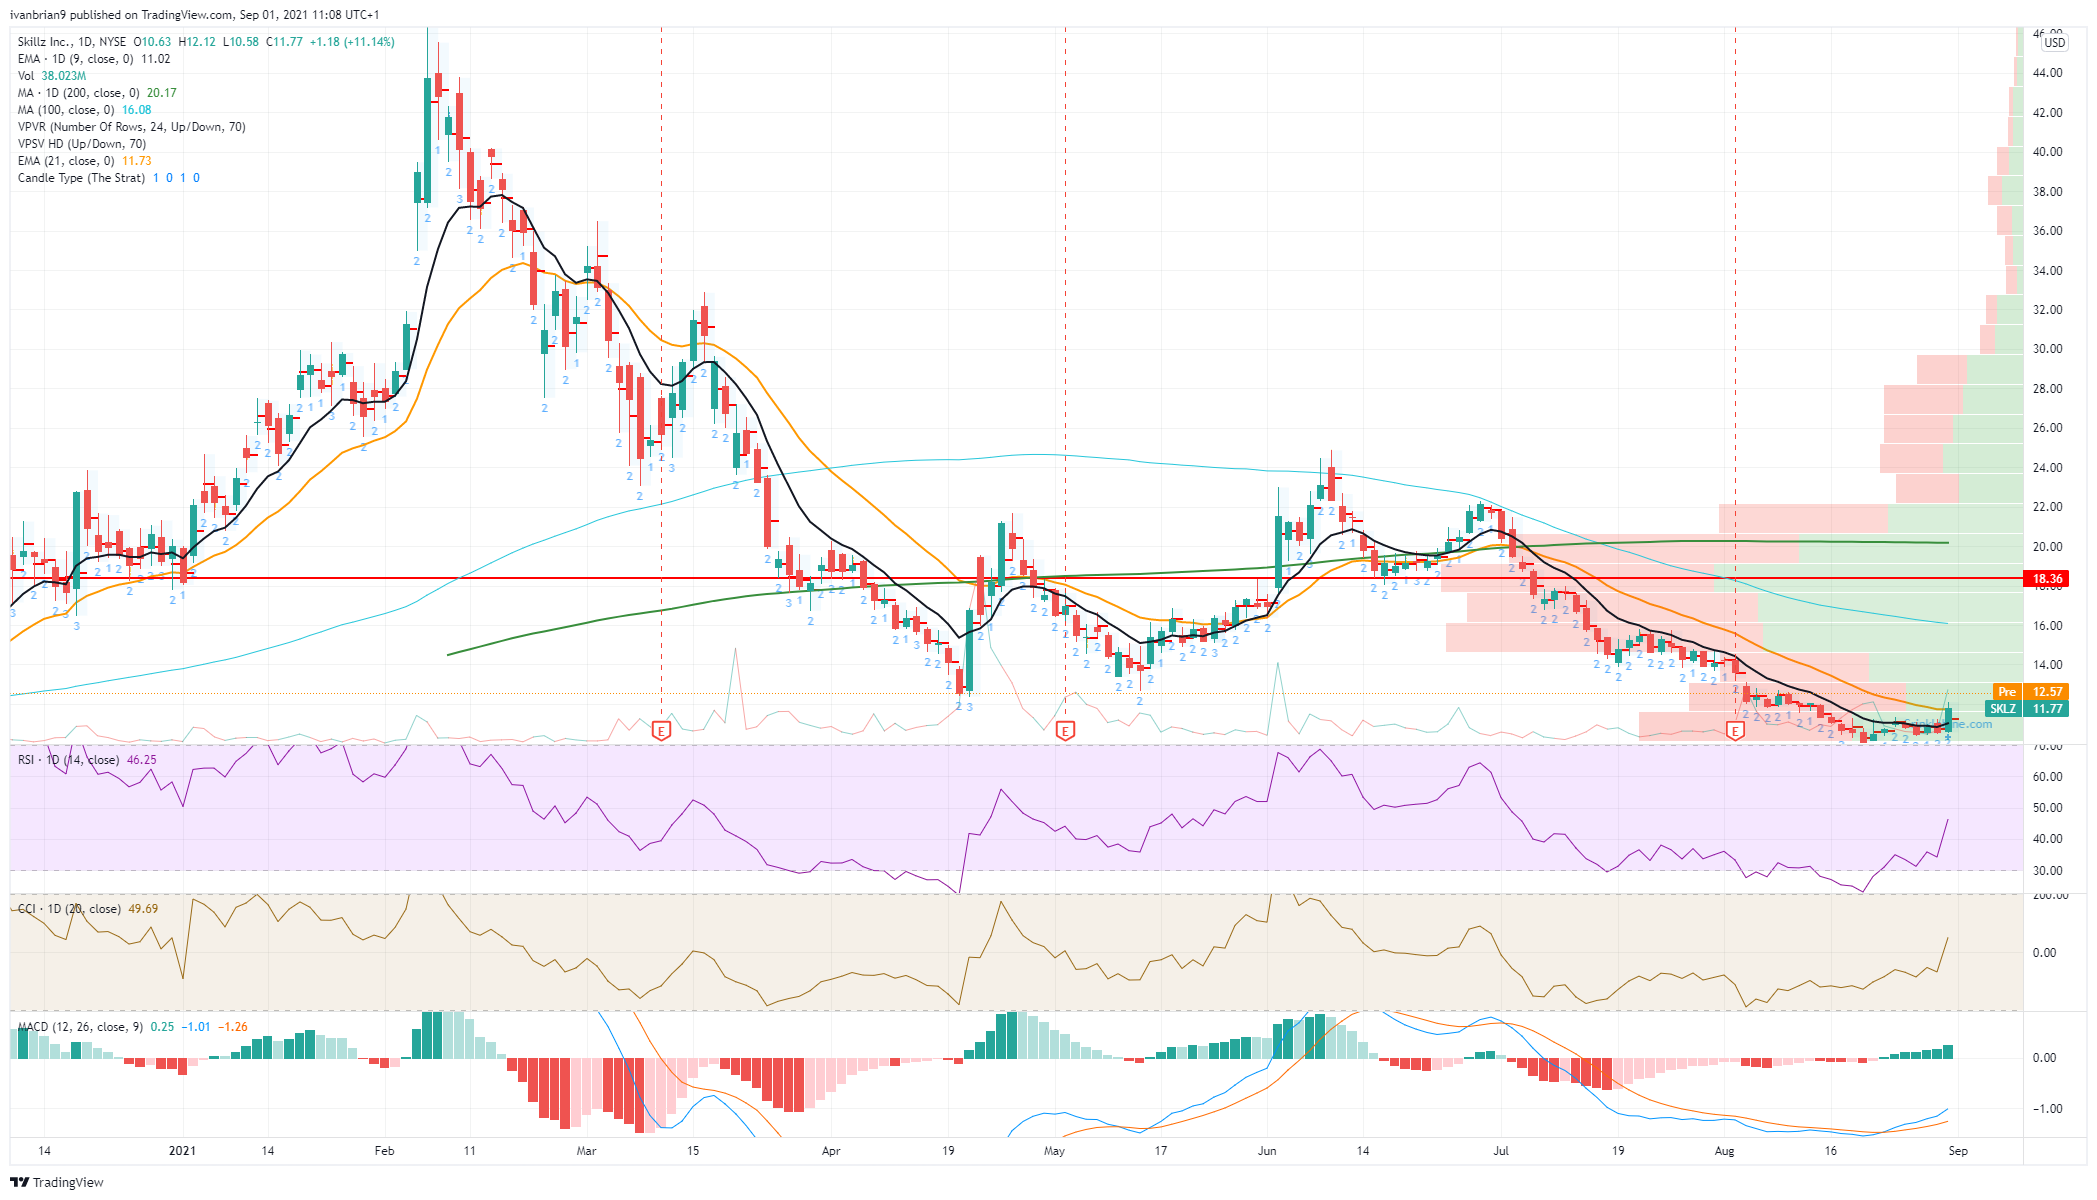
The biggest hurdle is going to be the amount of volume SKLZ has to get through. Look at those volume profile bars on the right. Once SKLZ gets to $15, there is heavy volume. That means more resistance. In a perfect world, a breakout would also have little volume resistance and would provide the perfect setup. Nothing is ever perfect usually, so the move can get to $15 but may slow afterwards. Volume does not thin out again until the stock gets above $22, so we will talk again then! 

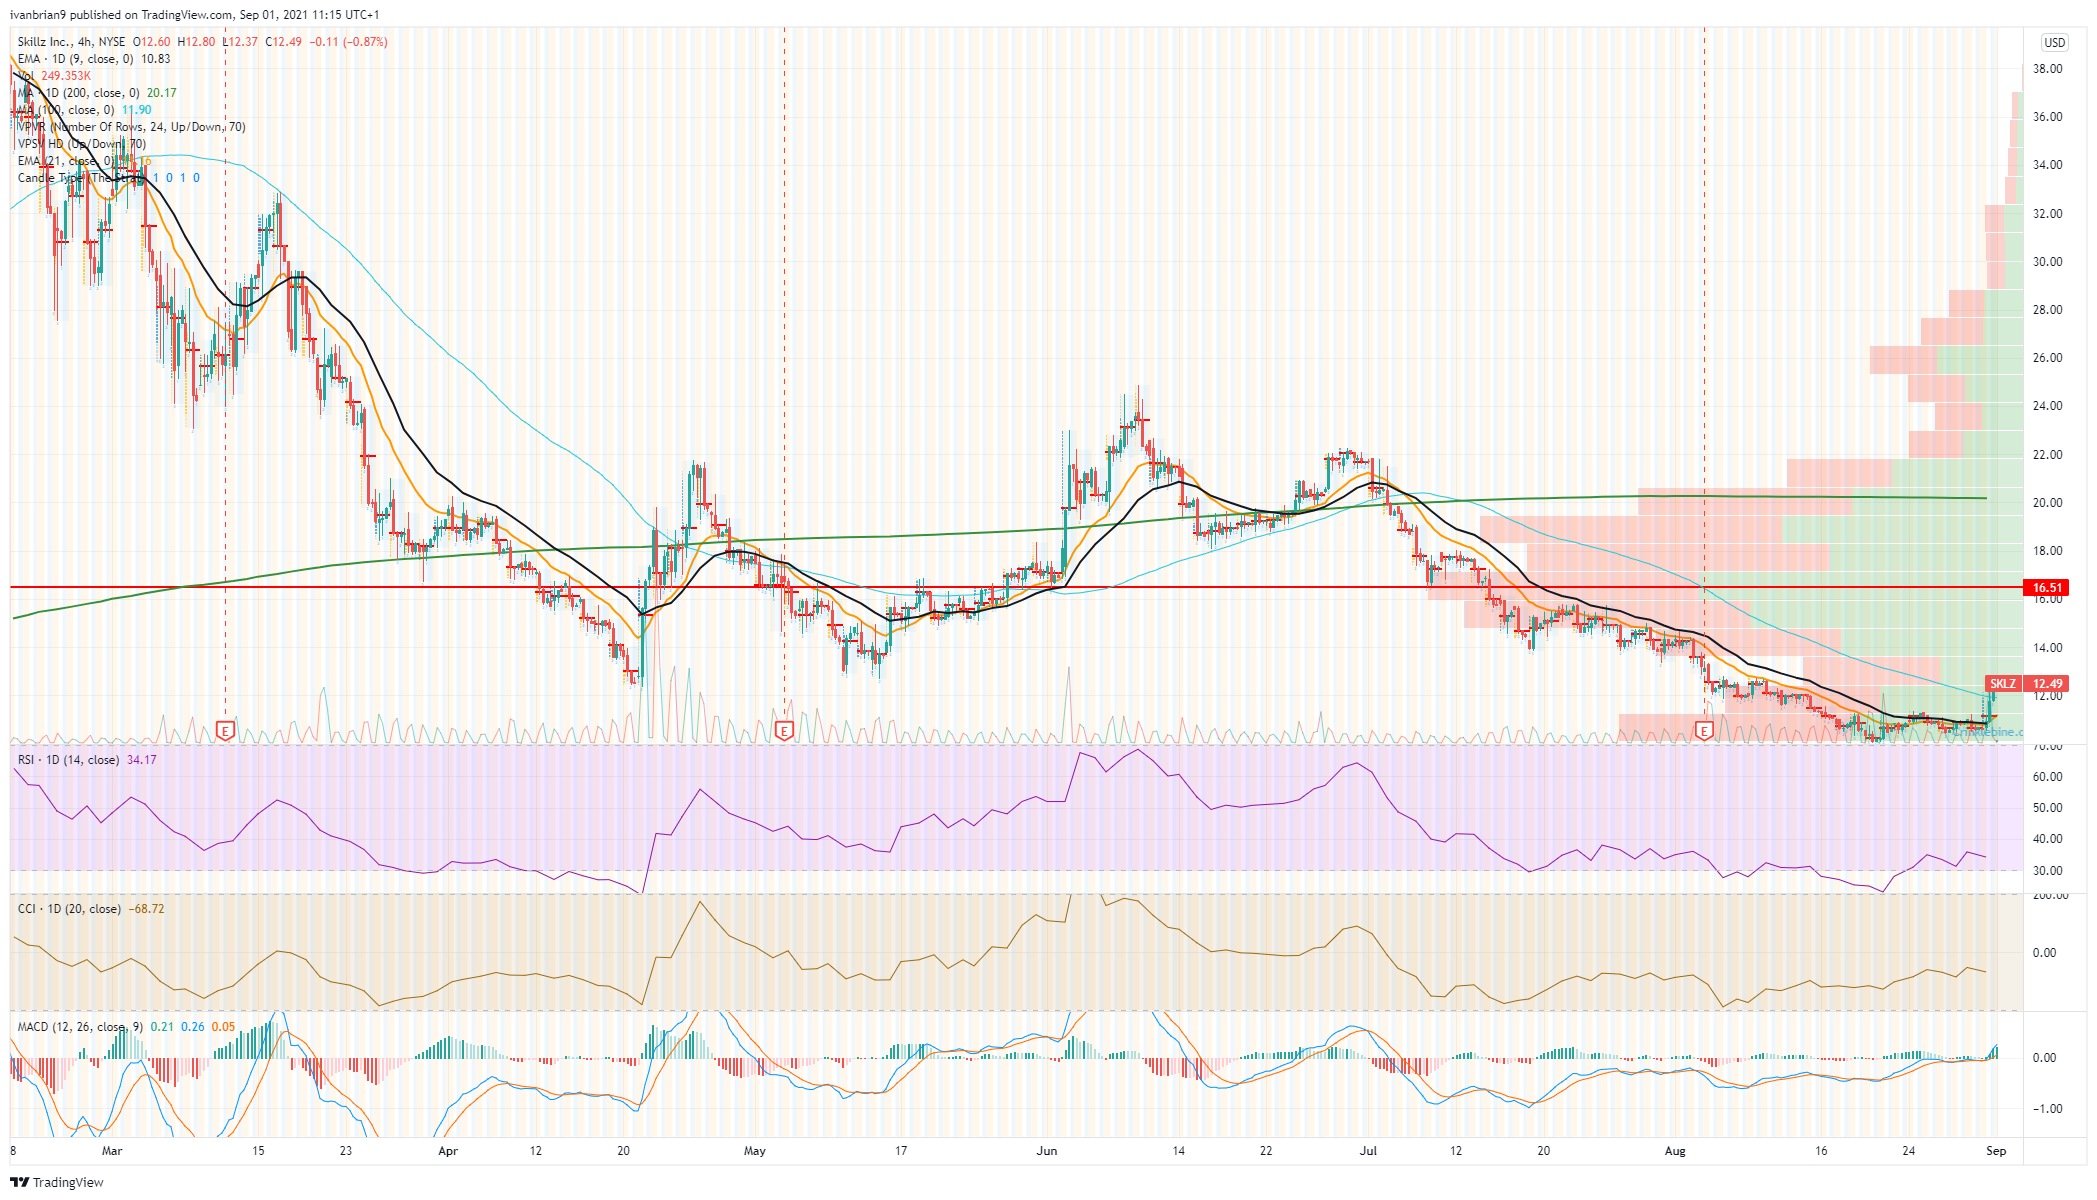
The closer view on the four-hour chart below shows us the point of control at $16.51 (price with the highest volume) and volume starting to increase from $14. There is a volume gap from $12 to $14, which is a not-too-shabby 20% plus gain, but once we get into heavy volume traffic consider taking some longs off the table to bank some profits and then you can let some ride and have a free shot. Always use stops to manage risk.


Like this article? Help us with some feedback by answering this survey:

Share: Feed news

Information on these pages contains forward-looking statements that involve risks and uncertainties. Markets and instruments profiled on this page are for informational purposes only and should not in any way come across as a recommendation to buy or sell in these assets. You should do your own thorough research before making any investment decisions. FXStreet does not in any way guarantee that this information is free from mistakes, errors, or material misstatements. It also does not guarantee that this information is of a timely nature. Investing in Open Markets involves a great deal of risk, including the loss of all or a portion of your investment, as well as emotional distress. All risks, losses and costs associated with investing, including total loss of principal, are your responsibility. The views and opinions expressed in this article are those of the authors and do not necessarily reflect the official policy or position of FXStreet nor its advertisers. The author will not be held responsible for information that is found at the end of links posted on this page.

If not otherwise explicitly mentioned in the body of the article, at the time of writing, the author has no position in any stock mentioned in this article and no business relationship with any company mentioned. The author has not received compensation for writing this article, other than from FXStreet.

FXStreet and the author do not provide personalized recommendations. The author makes no representations as to the accuracy, completeness, or suitability of this information. FXStreet and the author will not be liable for any errors, omissions or any losses, injuries or damages arising from this information and its display or use. Errors and omissions excepted.

The author and FXStreet are not registered investment advisors and nothing in this article is intended to be investment advice.

Recommended content


Recommended content

Editors’ Picks

EUR/USD strengthens above 1.1600 on risk-on mood

EUR/USD strengthens above 1.1600 on risk-on mood

The EUR/USD pair edges higher to around 1.1615 during the early European session on Wednesday. The improved risk sentiment provides some support to the Euro against the Greenback. Traders will take more cues from the Federal Reserve’s Chair Jerome Powell testifies later on Wednesday.

GBP/USD holds gains above 1.3600 due to improved risk appetite

GBP/USD holds gains above 1.3600 due to improved risk appetite

GBP/USD extends its winning streak for the third successive session, trading around 1.3620 during the Asian hours on Wednesday. The pair is hovering around 1.3648, the highest since February 2022, which was recorded on Tuesday. The risk-sensitive GBP/USD pair receives support from the improved risk appetite amid easing tensions in the Middle East.

Gold price struggles to lure buyers as easing Middle East tensions offsets weaker USD

Gold price struggles to lure buyers as easing Middle East tensions offsets weaker USD

Gold price edges higher as Fed rate cut bets keep the USD bulls on the defensive. Doubts over the durability of the Israel-Iran ceasefire also support the commodity. Traders look forward to this week’s important US macro data for a fresh impetus.

Bitcoin, Ethereum and Ripple eye key breakouts

Bitcoin, Ethereum and Ripple eye key breakouts

Bitcoin price continued to trade in green on Wednesday, having risen 5% over the previous two days. Ethereum and Ripple followed BTC’s footsteps and rallied, approaching their key resistance levels, where a breakout would suggest further upside moves.

Could Iran block the Strait of Hormuz? Why Oil is on edge after US strikes

Could Iran block the Strait of Hormuz? Why Oil is on edge after US strikes

As the Israel-Iran conflict reaches new heights, an old threat is coming back to haunt the markets: that of the closure of the Strait of Hormuz. This narrow arm of the sea in the Persian Gulf, wedged between Iran to the north and the United Arab Emirates and Oman to the south, is much more than a simple sea passage.

The Best brokers to trade EUR/USD

The Best brokers to trade EUR/USD

SPONSORED Discover the top brokers for trading EUR/USD in 2025. Our list features brokers with competitive spreads, fast execution, and powerful platforms. Whether you're a beginner or an expert, find the right partner to navigate the dynamic Forex market.

Forex MAJORS

Cryptocurrencies

Signatures

Best Brokers of 2025