Silver Price Forecast: XAG/USD tumbles to near $28.70 as US Dollar recovers ahead of US data
- Silver price faces a sharp sell-off near the weekly high at $29.16 as the US Dollar recovers strongly.
- An unexpected contraction in the Caixin Manufacturing PMI for July has also weighed on the Silver price.
- The Fed signaled rate cuts in September amid cooling inflationary pressures and easing labor market strength.

Silver price (XAG/USD) falls sharply to near $28.70 in Thursday’s European session after posting a fresh weekly high at $29.16. The white metal drops as the US Dollar (USD) rebounds strongly, and the Caixin Manufacturing PMI surprisingly contracted in July.
The US Dollar Index (DXY), which tracks the Greenback’s value against six major currencies, jumps higher to near 104.35 after rebounding from a weekly low of 103.86. A sharp recovery in the US Dollar has made investment in Silver expensive for investors.
Apart from that, unexpected decline in the Caxin Manufacturing PMI to 49.8 from expectations of 51.5 and the prior release of 51.8 has weighed on the Silver price. Silver as a metal has application in various industries such as renewable energy and electric vehicles etc. And, a slowdown in China’s manufacturing sector raises concerns over Silver demand.
However, firm speculation that the Federal Reserve (Fed) will start reducing interest rates in September will keep the downside limited. The Fed left interest rates unchanged in the range of 5.25%-5.50% on Wednesday, as expected, and his acknowledgment of cooling price pressures and easing labor market strength pointed to expectations of rate cuts sooner rather than later.
Going forward, investors will focus on the United States ISM Manufacturing PMI and Nonfarm Payrolls (NFP) report for July, which will be published at 14:00 GMT and on Friday, respectively.
Silver technical analysis
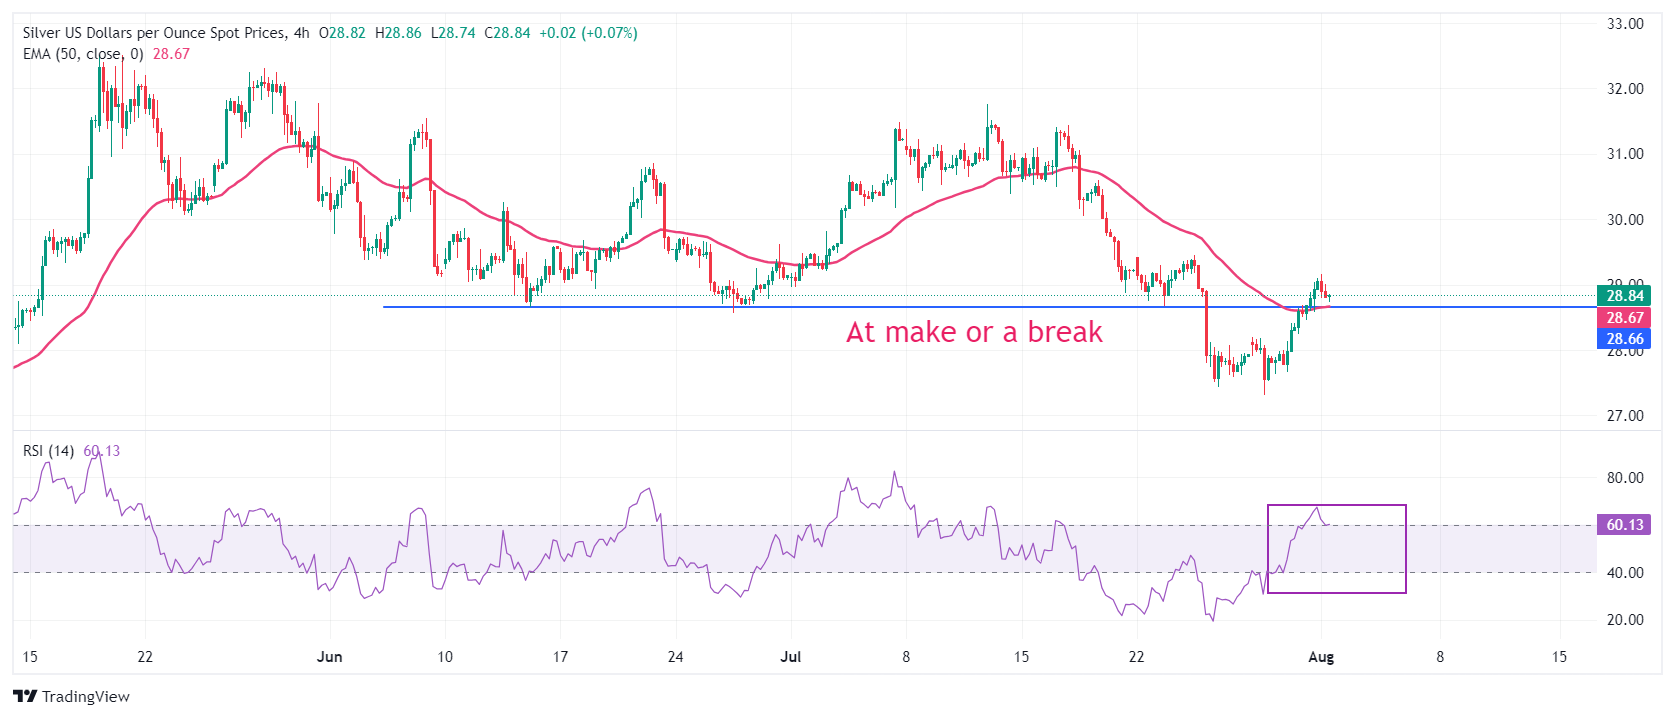
Silver price hovers at make or a break near the horizontal resistance plotted from June 13 low at $28.66 on a four-hour timeframe. The asset climbs above the 50-period Exponential Moving Average (EMA) near $28.70, suggesting that the near-term trend is upbeat.
The 14-period Relative Strength Index (RSI) moves higher above 60.00. If the RSI sustains above 60.00, the momentum will shift to the upside.
Silver four-hour chart
Silver FAQs
Silver is a precious metal highly traded among investors. It has been historically used as a store of value and a medium of exchange. Although less popular than Gold, traders may turn to Silver to diversify their investment portfolio, for its intrinsic value or as a potential hedge during high-inflation periods. Investors can buy physical Silver, in coins or in bars, or trade it through vehicles such as Exchange Traded Funds, which track its price on international markets.
Silver prices can move due to a wide range of factors. Geopolitical instability or fears of a deep recession can make Silver price escalate due to its safe-haven status, although to a lesser extent than Gold's. As a yieldless asset, Silver tends to rise with lower interest rates. Its moves also depend on how the US Dollar (USD) behaves as the asset is priced in dollars (XAG/USD). A strong Dollar tends to keep the price of Silver at bay, whereas a weaker Dollar is likely to propel prices up. Other factors such as investment demand, mining supply – Silver is much more abundant than Gold – and recycling rates can also affect prices.
Silver is widely used in industry, particularly in sectors such as electronics or solar energy, as it has one of the highest electric conductivity of all metals – more than Copper and Gold. A surge in demand can increase prices, while a decline tends to lower them. Dynamics in the US, Chinese and Indian economies can also contribute to price swings: for the US and particularly China, their big industrial sectors use Silver in various processes; in India, consumers’ demand for the precious metal for jewellery also plays a key role in setting prices.
Silver prices tend to follow Gold's moves. When Gold prices rise, Silver typically follows suit, as their status as safe-haven assets is similar. The Gold/Silver ratio, which shows the number of ounces of Silver needed to equal the value of one ounce of Gold, may help to determine the relative valuation between both metals. Some investors may consider a high ratio as an indicator that Silver is undervalued, or Gold is overvalued. On the contrary, a low ratio might suggest that Gold is undervalued relative to Silver.
Author

Sagar Dua
FXStreet
Sagar Dua is associated with the financial markets from his college days. Along with pursuing post-graduation in Commerce in 2014, he started his markets training with chart analysis.


