Silver Price Forecast: XAG/USD tumbles below $32 on blowout US jobs data
- Silver price falls sharply below $32.00 as US bond yields rise further.
- Surprisingly upbeat US NFP data forced traders to pare Fed large rate cut bets.
- Middle East tensions are expected to offer support to the Silver price.

Silver price (XAG/USD) extends its downside below $32.00 in Monday’s European session. The white metal weakens as the US bond yields rise further, given that the likelihood of the Federal Reserve (Fed) delivering another larger-than-usual 50 basis points (bps) interest rate cut in November has gone off the table.
10-year US Treasury yields jump slightly above 4%. Higher yields on interest-bearing assets reduce the opportunity cost of holding an investment in non-yielding assets, such as Silver. The US Dollar Index (DXY), which tracks the Greenback’s value against six major currencies, clings to gains near 102.50.
However, the Silver is unlikely to turn extremely bearish amid growing tensions between Iran and Israel. Historically, geopolitical tensions improve demand for precious metals as a safe haven.
Market speculation for Fed large rate cuts waned after the United States (US) employment report for September showed strong labor demand and robust wage growth. Traders are pricing a Fed 25 bps interest rate cut in November, according to the CME FedWatch tool.
Upbeat labor market data has diminished fears of an economic slowdown, which forced traders to be bet for a second consecutive 50 bps interest rate cut in September.
Going forward, the next move in the Silver price will be influenced by the US Consumer Price Index (CPI) data for September, which will be published on Thursday. Economists expect the core CPI – which excludes volatile food and energy prices – to have grown steadily by 3.2%.
Silver technical analysis
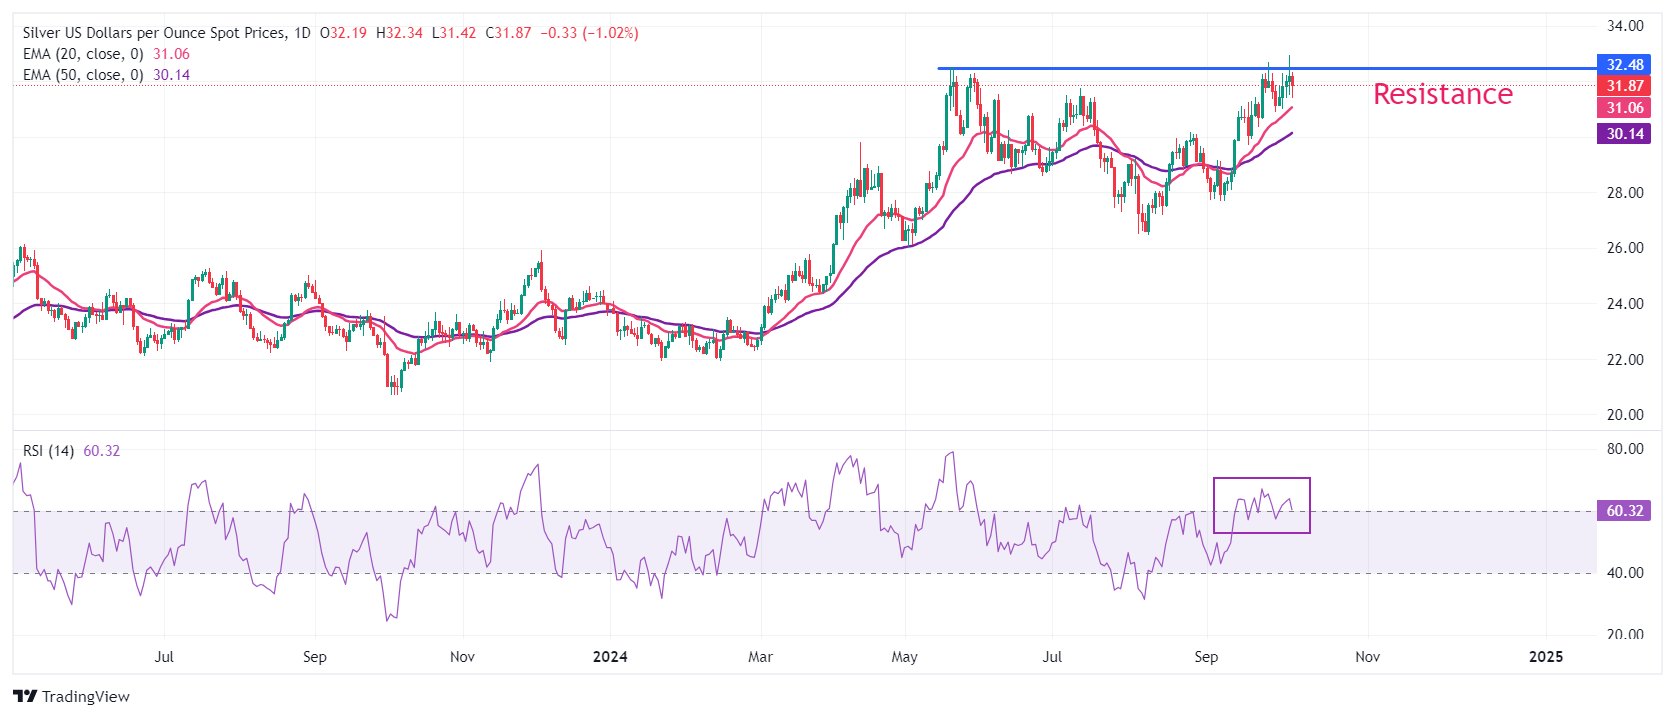
Silver price continues to face pressure near the horizontal resistance plotted from the May 20 high of $32.50 on a daily timeframe. The white metal strives for more upside as the outlook is upbeat due to upward-sloping 20 and 50-day Exponential Moving Averages (EMAs), which trade around $31.00 and $30.00, respectively.
The 14-day Relative Strength Index (RSI) remains in the bullish range of 60.00-80.00, suggesting more upside ahead.
Silver daily chart
Silver FAQs
Silver is a precious metal highly traded among investors. It has been historically used as a store of value and a medium of exchange. Although less popular than Gold, traders may turn to Silver to diversify their investment portfolio, for its intrinsic value or as a potential hedge during high-inflation periods. Investors can buy physical Silver, in coins or in bars, or trade it through vehicles such as Exchange Traded Funds, which track its price on international markets.
Silver prices can move due to a wide range of factors. Geopolitical instability or fears of a deep recession can make Silver price escalate due to its safe-haven status, although to a lesser extent than Gold's. As a yieldless asset, Silver tends to rise with lower interest rates. Its moves also depend on how the US Dollar (USD) behaves as the asset is priced in dollars (XAG/USD). A strong Dollar tends to keep the price of Silver at bay, whereas a weaker Dollar is likely to propel prices up. Other factors such as investment demand, mining supply – Silver is much more abundant than Gold – and recycling rates can also affect prices.
Silver is widely used in industry, particularly in sectors such as electronics or solar energy, as it has one of the highest electric conductivity of all metals – more than Copper and Gold. A surge in demand can increase prices, while a decline tends to lower them. Dynamics in the US, Chinese and Indian economies can also contribute to price swings: for the US and particularly China, their big industrial sectors use Silver in various processes; in India, consumers’ demand for the precious metal for jewellery also plays a key role in setting prices.
Silver prices tend to follow Gold's moves. When Gold prices rise, Silver typically follows suit, as their status as safe-haven assets is similar. The Gold/Silver ratio, which shows the number of ounces of Silver needed to equal the value of one ounce of Gold, may help to determine the relative valuation between both metals. Some investors may consider a high ratio as an indicator that Silver is undervalued, or Gold is overvalued. On the contrary, a low ratio might suggest that Gold is undervalued relative to Silver.
Author

Sagar Dua
FXStreet
Sagar Dua is associated with the financial markets from his college days. Along with pursuing post-graduation in Commerce in 2014, he started his markets training with chart analysis.


