Silver Price Forecast: XAG/USD trades with modest losses above $34.00, bullish bias remains
- Silver struggles to capitalize on the precious day’s positive move and drifts lower on Wednesday.
- The technical setup favors bulls and supports prospects for the emergence of some dip-buying.
- A sustained break below the $33.10-$33.00 area is needed to negate the near-term positive bias.

Silver (XAG/USD) meets with a fresh supply on Wednesday and drops back closer to the $34.00 mark during the first half of the European session, reversing a part of the previous day's move up.
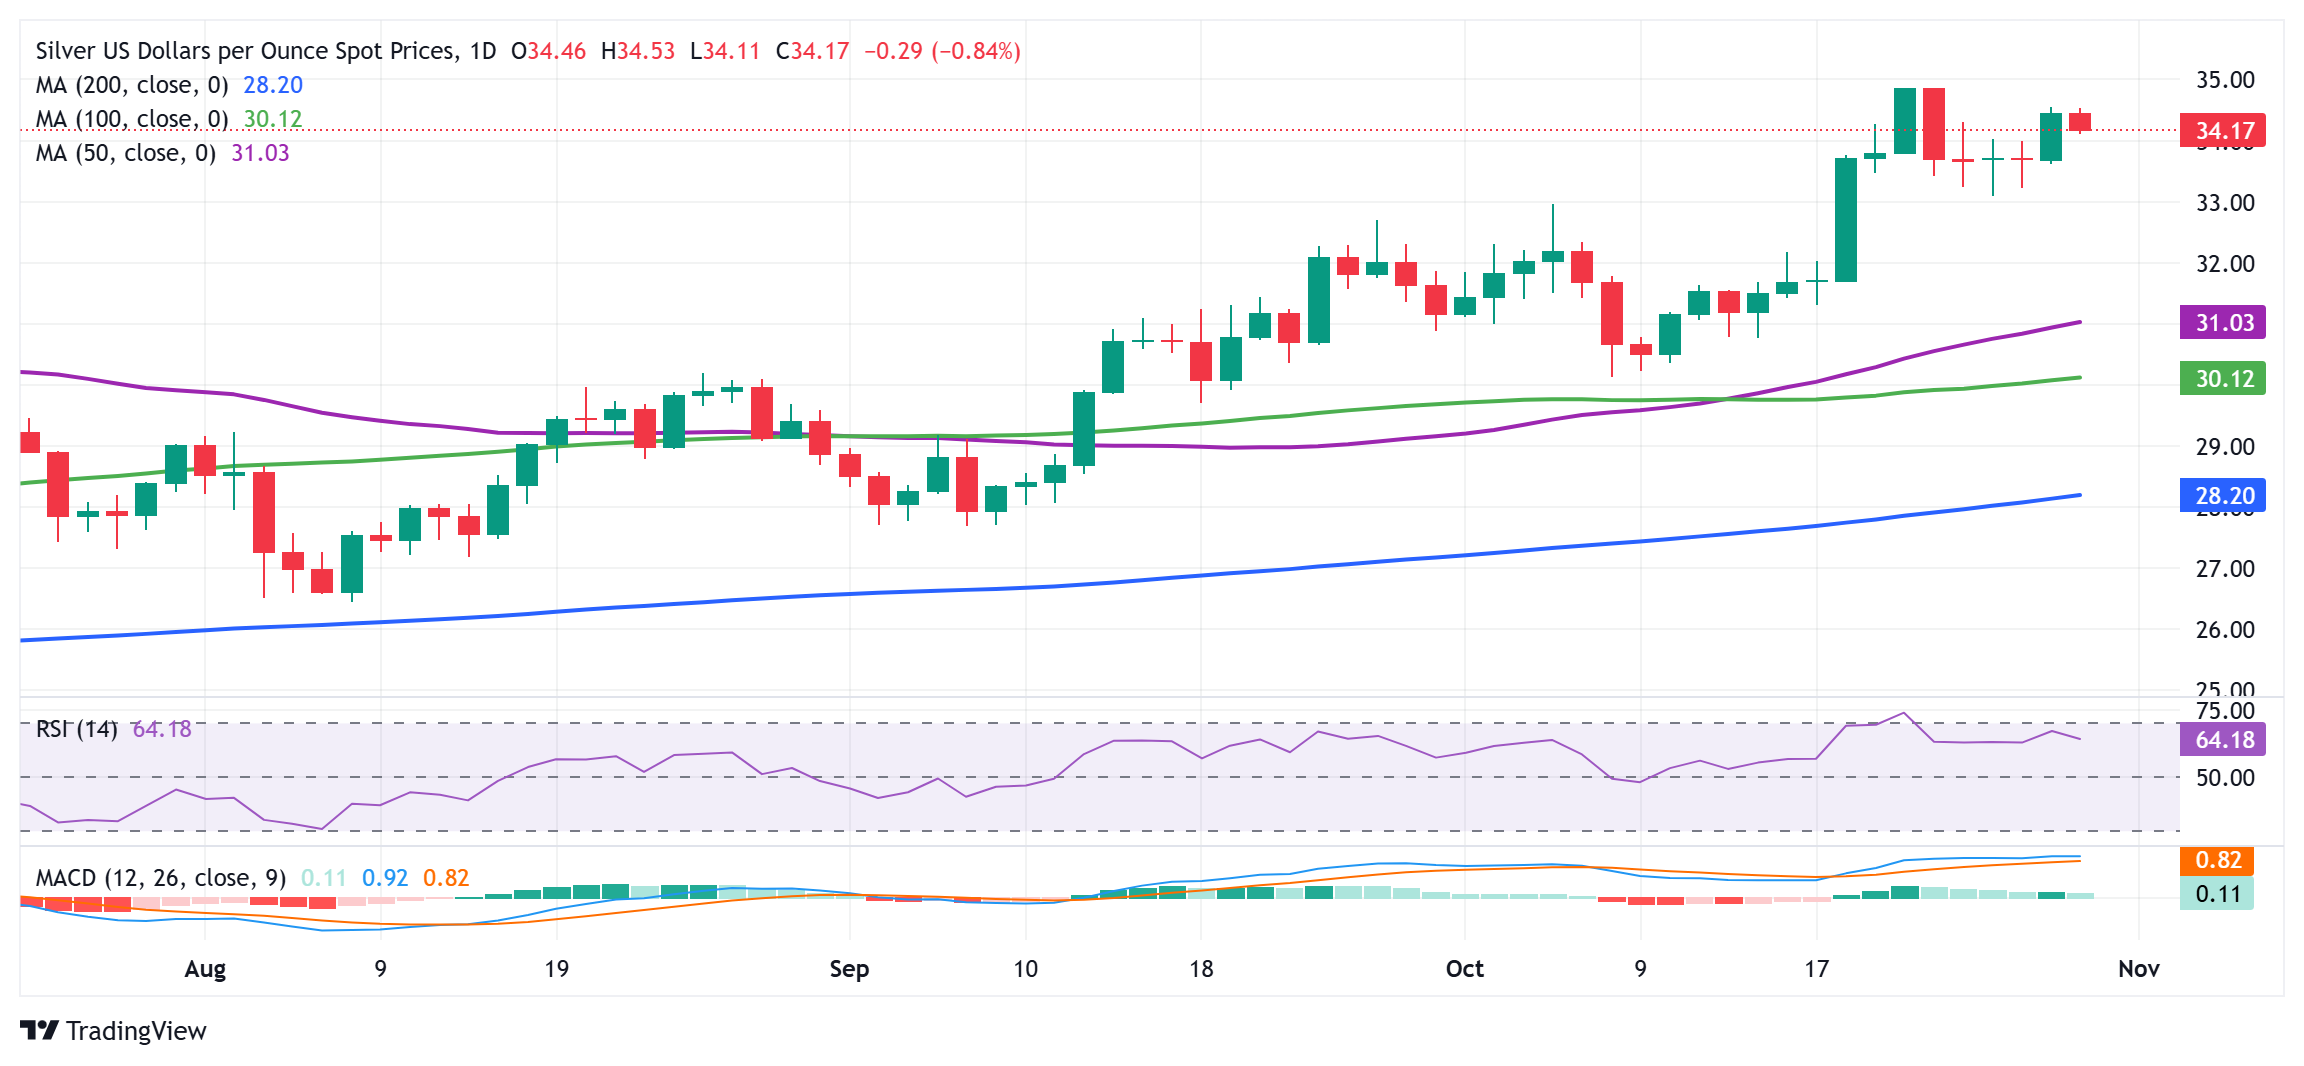
From a technical perspective, the XAG/USD is holding comfortably above important daily moving averages – 50-day, 100-day and 200-day SMAs. Moreover, oscillators on the daily chart maintain their positive bias and are still away from being in the overbought territory, suggesting that the path of least resistance for the white metal remains to the upside.
Hence, any subsequent slide is more likely to find decent support near the $33.70 horizontal zone. This is followed by last week's swing low, around the $33.10 area, which if broken decisively might shift the bias in favor of bearish traders. The XAG/USD might then accelerate the slide towards the $32.20-$32.15 intermediate support en route to the $32.00 round figure.
Some follow-through selling below the $31.70-$31.65 region could drag the XAG/USD towards the $31.00 mark. The downward trajectory could extend further towards the $30.50 area and the monthly swing low, close to the $30.00 psychological mark tested on October 8.
On the flip side, bulls might now wait for a sustained strength beyond the $34.50-$34.55 area before making a fresh attempt to conquer the $35.00 psychological mark. The subsequent move up has the potential to lift the XAG/USD further towards the October 2012 swing high, around the $35.35-$35.40 region.
Silver daily chart
Silver FAQs
Silver is a precious metal highly traded among investors. It has been historically used as a store of value and a medium of exchange. Although less popular than Gold, traders may turn to Silver to diversify their investment portfolio, for its intrinsic value or as a potential hedge during high-inflation periods. Investors can buy physical Silver, in coins or in bars, or trade it through vehicles such as Exchange Traded Funds, which track its price on international markets.
Silver prices can move due to a wide range of factors. Geopolitical instability or fears of a deep recession can make Silver price escalate due to its safe-haven status, although to a lesser extent than Gold's. As a yieldless asset, Silver tends to rise with lower interest rates. Its moves also depend on how the US Dollar (USD) behaves as the asset is priced in dollars (XAG/USD). A strong Dollar tends to keep the price of Silver at bay, whereas a weaker Dollar is likely to propel prices up. Other factors such as investment demand, mining supply – Silver is much more abundant than Gold – and recycling rates can also affect prices.
Silver is widely used in industry, particularly in sectors such as electronics or solar energy, as it has one of the highest electric conductivity of all metals – more than Copper and Gold. A surge in demand can increase prices, while a decline tends to lower them. Dynamics in the US, Chinese and Indian economies can also contribute to price swings: for the US and particularly China, their big industrial sectors use Silver in various processes; in India, consumers’ demand for the precious metal for jewellery also plays a key role in setting prices.
Silver prices tend to follow Gold's moves. When Gold prices rise, Silver typically follows suit, as their status as safe-haven assets is similar. The Gold/Silver ratio, which shows the number of ounces of Silver needed to equal the value of one ounce of Gold, may help to determine the relative valuation between both metals. Some investors may consider a high ratio as an indicator that Silver is undervalued, or Gold is overvalued. On the contrary, a low ratio might suggest that Gold is undervalued relative to Silver.
Author

Haresh Menghani
FXStreet
Haresh Menghani is a detail-oriented professional with 10+ years of extensive experience in analysing the global financial markets.


