Silver Price Forecast: XAG/USD trades near weekly low around $29.50 in quiet trading mood
- Silver price hovers near $29.50 in an illiquid market with the US Dollar and bond yields closing the calendar year on a strong note.
- The Fed sees the federal fund rate heading to 3.9% by the end of 2025.
- Strong US economic growth prospects allowed the Fed to guide fewer interest rate cuts for the next year.

Silver price (XAG/USD) trades cautiously near Friday’s low around $29.50 in thin volume conditions before New Year on Monday. The white metal is broadly under pressure as the outlook of the US Dollar (USD) remains firm on expectations that a moderate policy-easing cycle by the Federal Reserve (Fed) in 2025 will keep US Treasury yields elevated.
10-year US Treasury yields are down 0.5% in Monday’s European session but are still almost 15% higher this calendar year near 4.60%.
The US Dollar Index (DXY), which tracks the Greenback’s value against six major currencies, ticks lower but remains broadly sideways around 108.00.
Market speculation for the Fed to follow a slower rate-cut path next year stemmed from the central bank’s latest dot plot, which showed that policymakers collectively see the Federal fund rate heading to 3.9% by the end of 2025.
Fed policymakers shifted their stance on interest rates from ‘dovish’ to ‘cautious’ as they were upbeat about the United States' (US) economic growth. Additionally, a slowdown in the disinflation process in the last few months forced them to guide fewer rate cuts for the next year.
This week, investors will focus on the US ISM Manufacturing PMI data for December, which will be released on Friday. The Manufacturing PMI is estimated to have come in at 48.3, slightly lower than 48.4, which suggests that manufacturing output contracted at a slightly faster pace.
Silver technical analysis
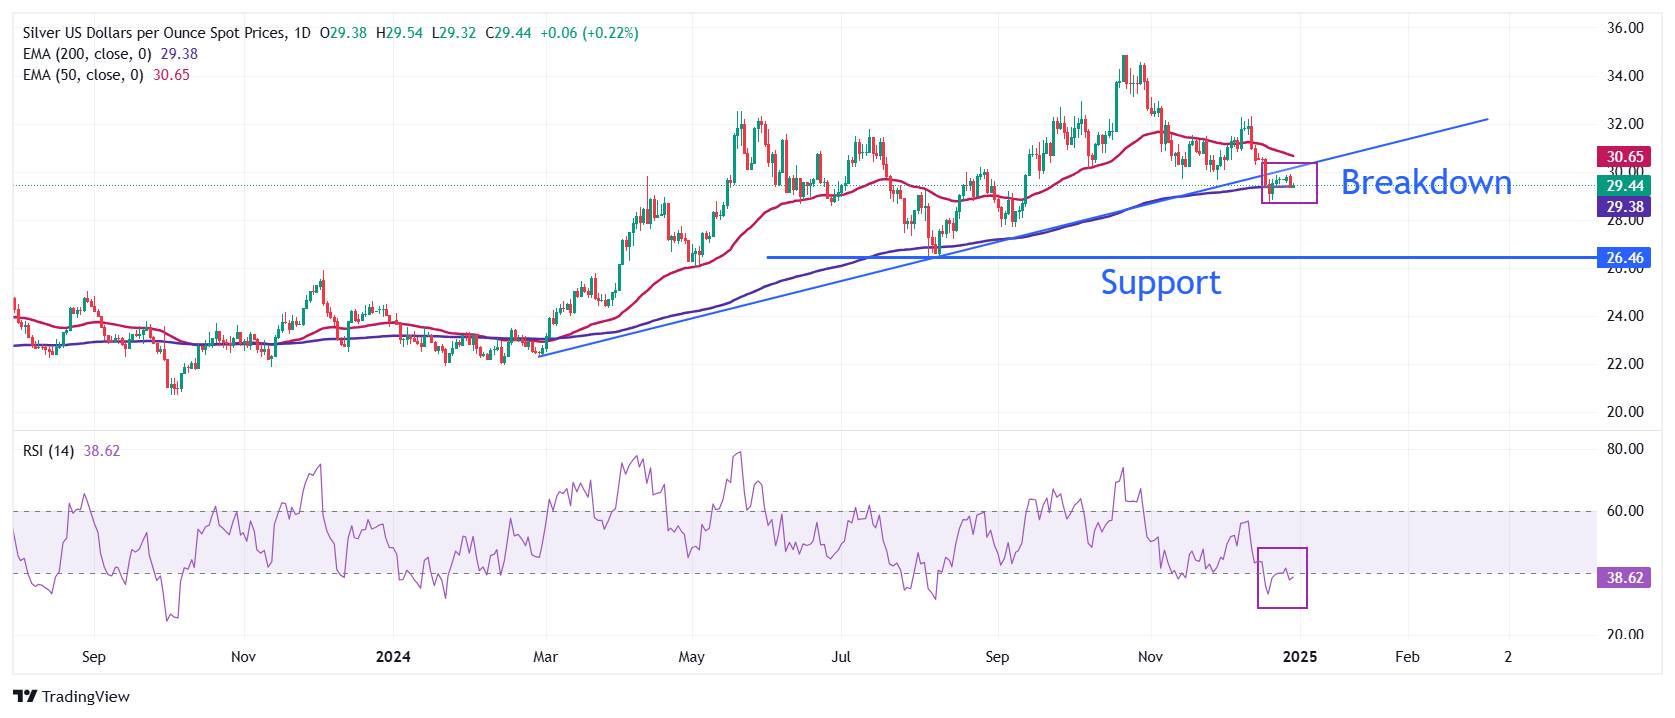
Silver price stays below the upward-sloping trendline after a breakdown near $30.00, which is plotted from the February 29 low of $22.30 on a daily timeframe,. The white metal wobbles around the 200-day Exponential Moving Average (EMA), suggesting that the longer-term outlook is uncertain.
The 14-day Relative Strength Index (RSI) falls inside the 20.00-40.00. A fresh bearish momentum would trigger if it sustains in that range.
Looking down, the September low of $27.75 would act as key support for the Silver price. On the upside, the 50-day EMA around $30.90 would be the barrier.
Silver daily chart
Silver FAQs
Silver is a precious metal highly traded among investors. It has been historically used as a store of value and a medium of exchange. Although less popular than Gold, traders may turn to Silver to diversify their investment portfolio, for its intrinsic value or as a potential hedge during high-inflation periods. Investors can buy physical Silver, in coins or in bars, or trade it through vehicles such as Exchange Traded Funds, which track its price on international markets.
Silver prices can move due to a wide range of factors. Geopolitical instability or fears of a deep recession can make Silver price escalate due to its safe-haven status, although to a lesser extent than Gold's. As a yieldless asset, Silver tends to rise with lower interest rates. Its moves also depend on how the US Dollar (USD) behaves as the asset is priced in dollars (XAG/USD). A strong Dollar tends to keep the price of Silver at bay, whereas a weaker Dollar is likely to propel prices up. Other factors such as investment demand, mining supply – Silver is much more abundant than Gold – and recycling rates can also affect prices.
Silver is widely used in industry, particularly in sectors such as electronics or solar energy, as it has one of the highest electric conductivity of all metals – more than Copper and Gold. A surge in demand can increase prices, while a decline tends to lower them. Dynamics in the US, Chinese and Indian economies can also contribute to price swings: for the US and particularly China, their big industrial sectors use Silver in various processes; in India, consumers’ demand for the precious metal for jewellery also plays a key role in setting prices.
Silver prices tend to follow Gold's moves. When Gold prices rise, Silver typically follows suit, as their status as safe-haven assets is similar. The Gold/Silver ratio, which shows the number of ounces of Silver needed to equal the value of one ounce of Gold, may help to determine the relative valuation between both metals. Some investors may consider a high ratio as an indicator that Silver is undervalued, or Gold is overvalued. On the contrary, a low ratio might suggest that Gold is undervalued relative to Silver.
Author

Sagar Dua
FXStreet
Sagar Dua is associated with the financial markets from his college days. Along with pursuing post-graduation in Commerce in 2014, he started his markets training with chart analysis.


