Silver Price Forecast: XAG/USD surges to near $31 after hotter-than-expected US Inflation
- Silver price climbs to near $31.00 despite the US inflation remained hotter-than-expected in September.
- The core CPI accelerated to 3.3% from estimates and the August reading of 3.2%.
- Traders expect the Fed to reduce interest rates by 25 bps next month.

Silver price (XAG/USD) strengthens and jumps to near $31.00 in Thursday’s North American session. The white metal witnessed strong buying interest after the release of the United States (US) Consumer Price Index (CPI) data for September.
The CPI report showed that Inflationary pressures grew at a faster-than-expected pace due to a sharp increase in prices of apparel. Also, medical and transportation services became more expensive.
The annual headline inflation decelerated at a slower-than-projected pace to 2.4% from 2.5% in August as the impact of a sharp decline in the cost of energy was offset by a rise in food prices. Economists estimated the headline inflation to have grown by 2.3%. The core CPI – which strips off volatile food and energy prices – accelerated to 3.3% from the estimates and the former release of 3.2%. The monthly headline and core inflation grew faster than projected.
The white metal struggles for direction as market participants are taking time to digest inflationary figures and adjust expectations for the Federal Reserve (Fed) interest rate outlook for the remaining year. According to the CME FedWatch tool, a 25-basis points (bps) rate cut in November is highly expected.
Meanwhile, the US Dollar (USD) is also displaying volatile moves after the US inflation data release. Going forward, investors will focus on the US Producer Price Index (PPI) data for September, which will be published on Friday.
Silver technical analysis
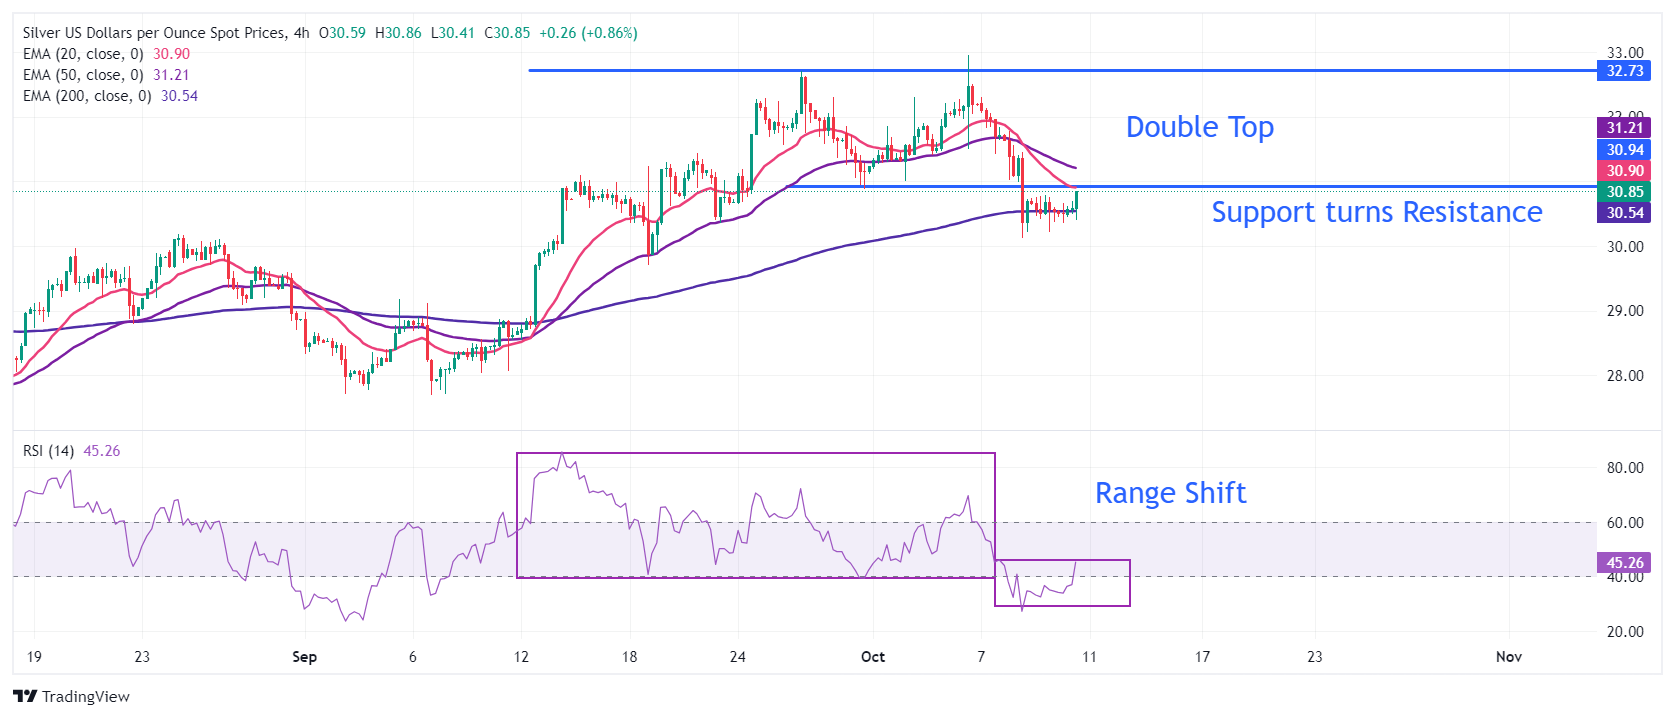
Silver price weakens after a breakdown of the Double Top formation on a four-hour timeframe. The above-mentioned pattern was activated after the asset broke below the horizontal support plotted from the September 30 low around $31.00, which acts as a resistance now. A bear cross, represented by the 20- and 50-period Exponential Moving Averages (EMAs) at $31.60, suggests weakness ahead.
The asset has temporarily found support near the 200 EMA, which trades around $30.50.
The 14-day Relative Strength Index (RSI) has delivered a range shift move, suggesting a bearish momentum.
Silver four-hour chart
Silver FAQs
Silver is a precious metal highly traded among investors. It has been historically used as a store of value and a medium of exchange. Although less popular than Gold, traders may turn to Silver to diversify their investment portfolio, for its intrinsic value or as a potential hedge during high-inflation periods. Investors can buy physical Silver, in coins or in bars, or trade it through vehicles such as Exchange Traded Funds, which track its price on international markets.
Silver prices can move due to a wide range of factors. Geopolitical instability or fears of a deep recession can make Silver price escalate due to its safe-haven status, although to a lesser extent than Gold's. As a yieldless asset, Silver tends to rise with lower interest rates. Its moves also depend on how the US Dollar (USD) behaves as the asset is priced in dollars (XAG/USD). A strong Dollar tends to keep the price of Silver at bay, whereas a weaker Dollar is likely to propel prices up. Other factors such as investment demand, mining supply – Silver is much more abundant than Gold – and recycling rates can also affect prices.
Silver is widely used in industry, particularly in sectors such as electronics or solar energy, as it has one of the highest electric conductivity of all metals – more than Copper and Gold. A surge in demand can increase prices, while a decline tends to lower them. Dynamics in the US, Chinese and Indian economies can also contribute to price swings: for the US and particularly China, their big industrial sectors use Silver in various processes; in India, consumers’ demand for the precious metal for jewellery also plays a key role in setting prices.
Silver prices tend to follow Gold's moves. When Gold prices rise, Silver typically follows suit, as their status as safe-haven assets is similar. The Gold/Silver ratio, which shows the number of ounces of Silver needed to equal the value of one ounce of Gold, may help to determine the relative valuation between both metals. Some investors may consider a high ratio as an indicator that Silver is undervalued, or Gold is overvalued. On the contrary, a low ratio might suggest that Gold is undervalued relative to Silver.
Author

Sagar Dua
FXStreet
Sagar Dua is associated with the financial markets from his college days. Along with pursuing post-graduation in Commerce in 2014, he started his markets training with chart analysis.