Silver Price Forecast: XAG/USD struggles near $30.40 area, seems vulnerable below 100-day SMA
- Silver meets with a fresh supply near the 100-day SMA pivotal support breakpoint.
- The technical setup suggests that the path of least resistance is to the downside.
- Bears might still wait for a sustained break and acceptance below the $30.00 mark.

Silver (XAG/USD) struggles to capitalize on the previous day's modest rebound from the vicinity of the monthly low, around the $30.00 psychological mark and attracts some sellers on Wednesday. The white metal remains depressed through the first half of the European session and currently trades just below mid-$30.00s, down nearly 0.30% for the day.
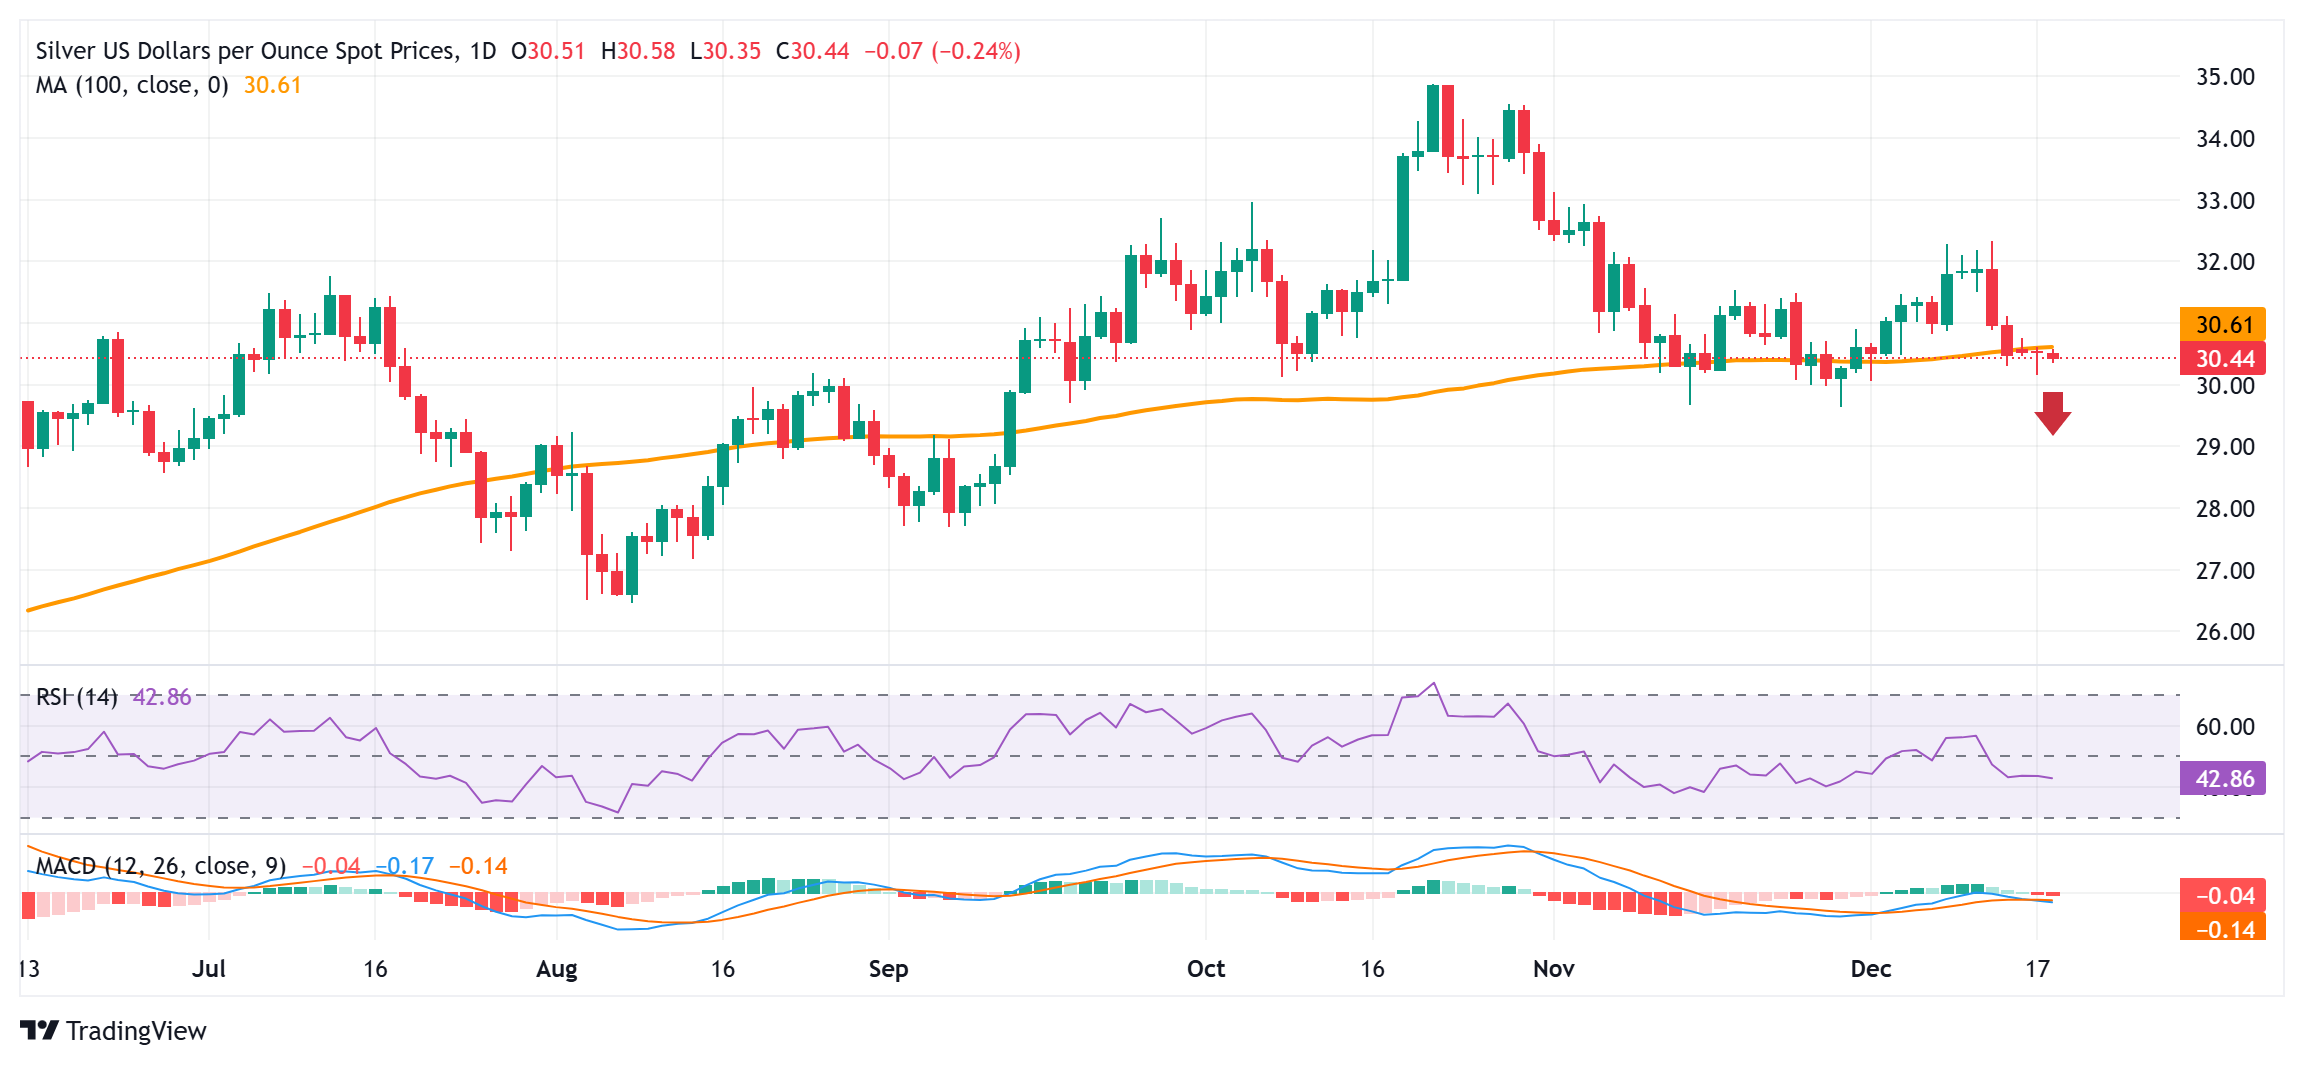
From a technical perspective, the recent failure near the $32.35 horizontal resistance and a subsequent slide back below the 100-day Simple Moving Average (SMA) favors bearish traders. Moreover, oscillators on the daily chart are holding in negative territory and are far from being in the oversold zone, suggesting that the path of least resistance for the XAG/USD is to the downside.
That said, it will still be prudent to wait for a sustained breakdown below the $30.00 mark before positioning for deeper losses. The XAG/USD might then weaken further below the November monthly swing low, around the $29.70-$29.65 area, towards testing the next relevant support near the $29.10-$29.00 region, which if broken should pave the way for an extension of a near two-month-old downtrend.
On the flip side, the 100-day SMA, currently around the $30.60 region, closely followed by the weekly top near the $30.75 area, now seems to act as an immediate hurdles. Some follow-through buying could assist the XAG/USD to reclaim the $31.00 mark and climb to the $31.45-$31.50 supply zone. The move up could extend towards the $32.00 round figure, which if cleared will negate the bearish outlook.
Silver daily chart
Silver FAQs
Silver is a precious metal highly traded among investors. It has been historically used as a store of value and a medium of exchange. Although less popular than Gold, traders may turn to Silver to diversify their investment portfolio, for its intrinsic value or as a potential hedge during high-inflation periods. Investors can buy physical Silver, in coins or in bars, or trade it through vehicles such as Exchange Traded Funds, which track its price on international markets.
Silver prices can move due to a wide range of factors. Geopolitical instability or fears of a deep recession can make Silver price escalate due to its safe-haven status, although to a lesser extent than Gold's. As a yieldless asset, Silver tends to rise with lower interest rates. Its moves also depend on how the US Dollar (USD) behaves as the asset is priced in dollars (XAG/USD). A strong Dollar tends to keep the price of Silver at bay, whereas a weaker Dollar is likely to propel prices up. Other factors such as investment demand, mining supply – Silver is much more abundant than Gold – and recycling rates can also affect prices.
Silver is widely used in industry, particularly in sectors such as electronics or solar energy, as it has one of the highest electric conductivity of all metals – more than Copper and Gold. A surge in demand can increase prices, while a decline tends to lower them. Dynamics in the US, Chinese and Indian economies can also contribute to price swings: for the US and particularly China, their big industrial sectors use Silver in various processes; in India, consumers’ demand for the precious metal for jewellery also plays a key role in setting prices.
Silver prices tend to follow Gold's moves. When Gold prices rise, Silver typically follows suit, as their status as safe-haven assets is similar. The Gold/Silver ratio, which shows the number of ounces of Silver needed to equal the value of one ounce of Gold, may help to determine the relative valuation between both metals. Some investors may consider a high ratio as an indicator that Silver is undervalued, or Gold is overvalued. On the contrary, a low ratio might suggest that Gold is undervalued relative to Silver.
Author

Haresh Menghani
FXStreet
Haresh Menghani is a detail-oriented professional with 10+ years of extensive experience in analysing the global financial markets.


