Silver Price Forecast: XAG/USD sees more downside below $29 ahead of US Inflation, Fed policy
- Silver price remains under pressure near $29.00 with a focus on the US CPI and the Fed policy outcome.
- The Fed is expected to maintain interest rates steady with hawkish guidance.
- Investors see the Fed cutting interest rates only once this year.

Silver price (XAG/USD) extends its downside to near the crucial support of $29.00 in Tuesday’s European session. The white metal weakens as the US Dollar (USD) and bond yields have performed strongly across the board due to a sharp decline in market expectations that the Federal Reserve (Fed) will start reducing interest rates from the September meeting.
Investors see the Fed lowering its key borrowing rates only once this year as fears for price pressures remaining persistent have deepened. The US Dollar Index (DXY) turns sideways after printing a fresh four-week high near 105.40. 10-year US Treasury yields have edged down to 4.44% in the London session but hold its strong recovery from 4.27%.
The next major triggers for the Silver price will be the May United States Consumer Price Index (CPI) data and the Fed’s interest rate decision. The CPI data will indicate whether the disinflation process is intact or has stalled. In the first quarter, the CPI report indicated that price pressures were higher than expected, while in April, they declined expectedly.
Meanwhile, the Fed’s decision is expected to remain status quo for the seventh time in a row as policymakers lack evidence that inflation is on course to return to the desired rate of 2%. Investors will focus on the Fed’s dot plot, which will indicate where policymakers see the federal fund rate heading. The CME FedWatch tool shows that 30-day Fed Fund Rate pricing data suggest only one rate-cut move this year.
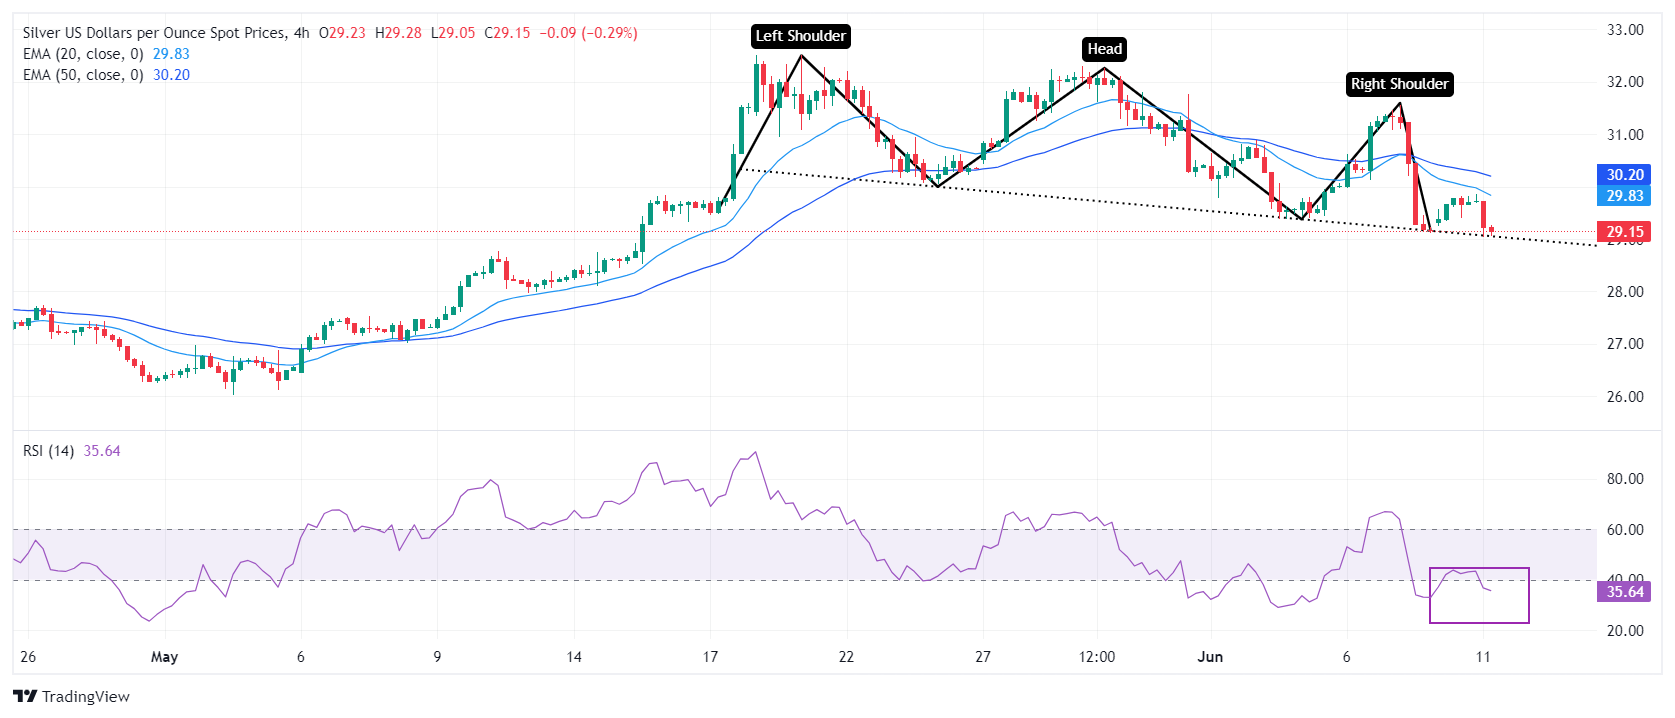
Silver technical analysis
Silver price trades close to the neckline of the Head and Shoulder (H&S) chart pattern, which is marked from May 24 low at $30.05 on a four-hour timeframe. A breakdown of the above-mentioned chart pattern results in a bearish reversal.
The near-term outlook remains uncertain after a bearish crossover of 20 and 50-day Exponential Moving Averages (EMAs) near $30.50.
The 14-period Relative Strength Index (RSI) has slipped into the 20.00-40.00 range, suggesting that the momentum has leaned toward the downside.
Silver four-hour chart
(This story was corrected on June 11 at 10:55 GMT to say, in the technical analysis section, that the neckline of the Head and Shoulders chart pattern is marked from the May 24 low at $30.05, not from the April 9 high at 1.0885.)
Author

Sagar Dua
FXStreet
Sagar Dua is associated with the financial markets from his college days. Along with pursuing post-graduation in Commerce in 2014, he started his markets training with chart analysis.


