Silver Price Forecast: XAG/USD seems poised to climb further, towards $31.00 mark
- Silver reverses an Asian session dip and turns positive for the second straight day.
- The technical setup favors bulls and supports prospects for further appreciation.
- Any meaningful dips could be seen as a buying opportunity near the $30.00 mark.

Silver (XAG/USD) attracts some dip-buying near the $30.20 area during the Asian session on Tuesday and looks to build on the overnight bounce from the vicinity of the 100-period Exponential Moving Average (EMA) on the 4-hour chart. The white metal, however, eases from a two-day high touched in the last hour and currently trades around the $30.60-$30.55 region, up 0.25% for the day.
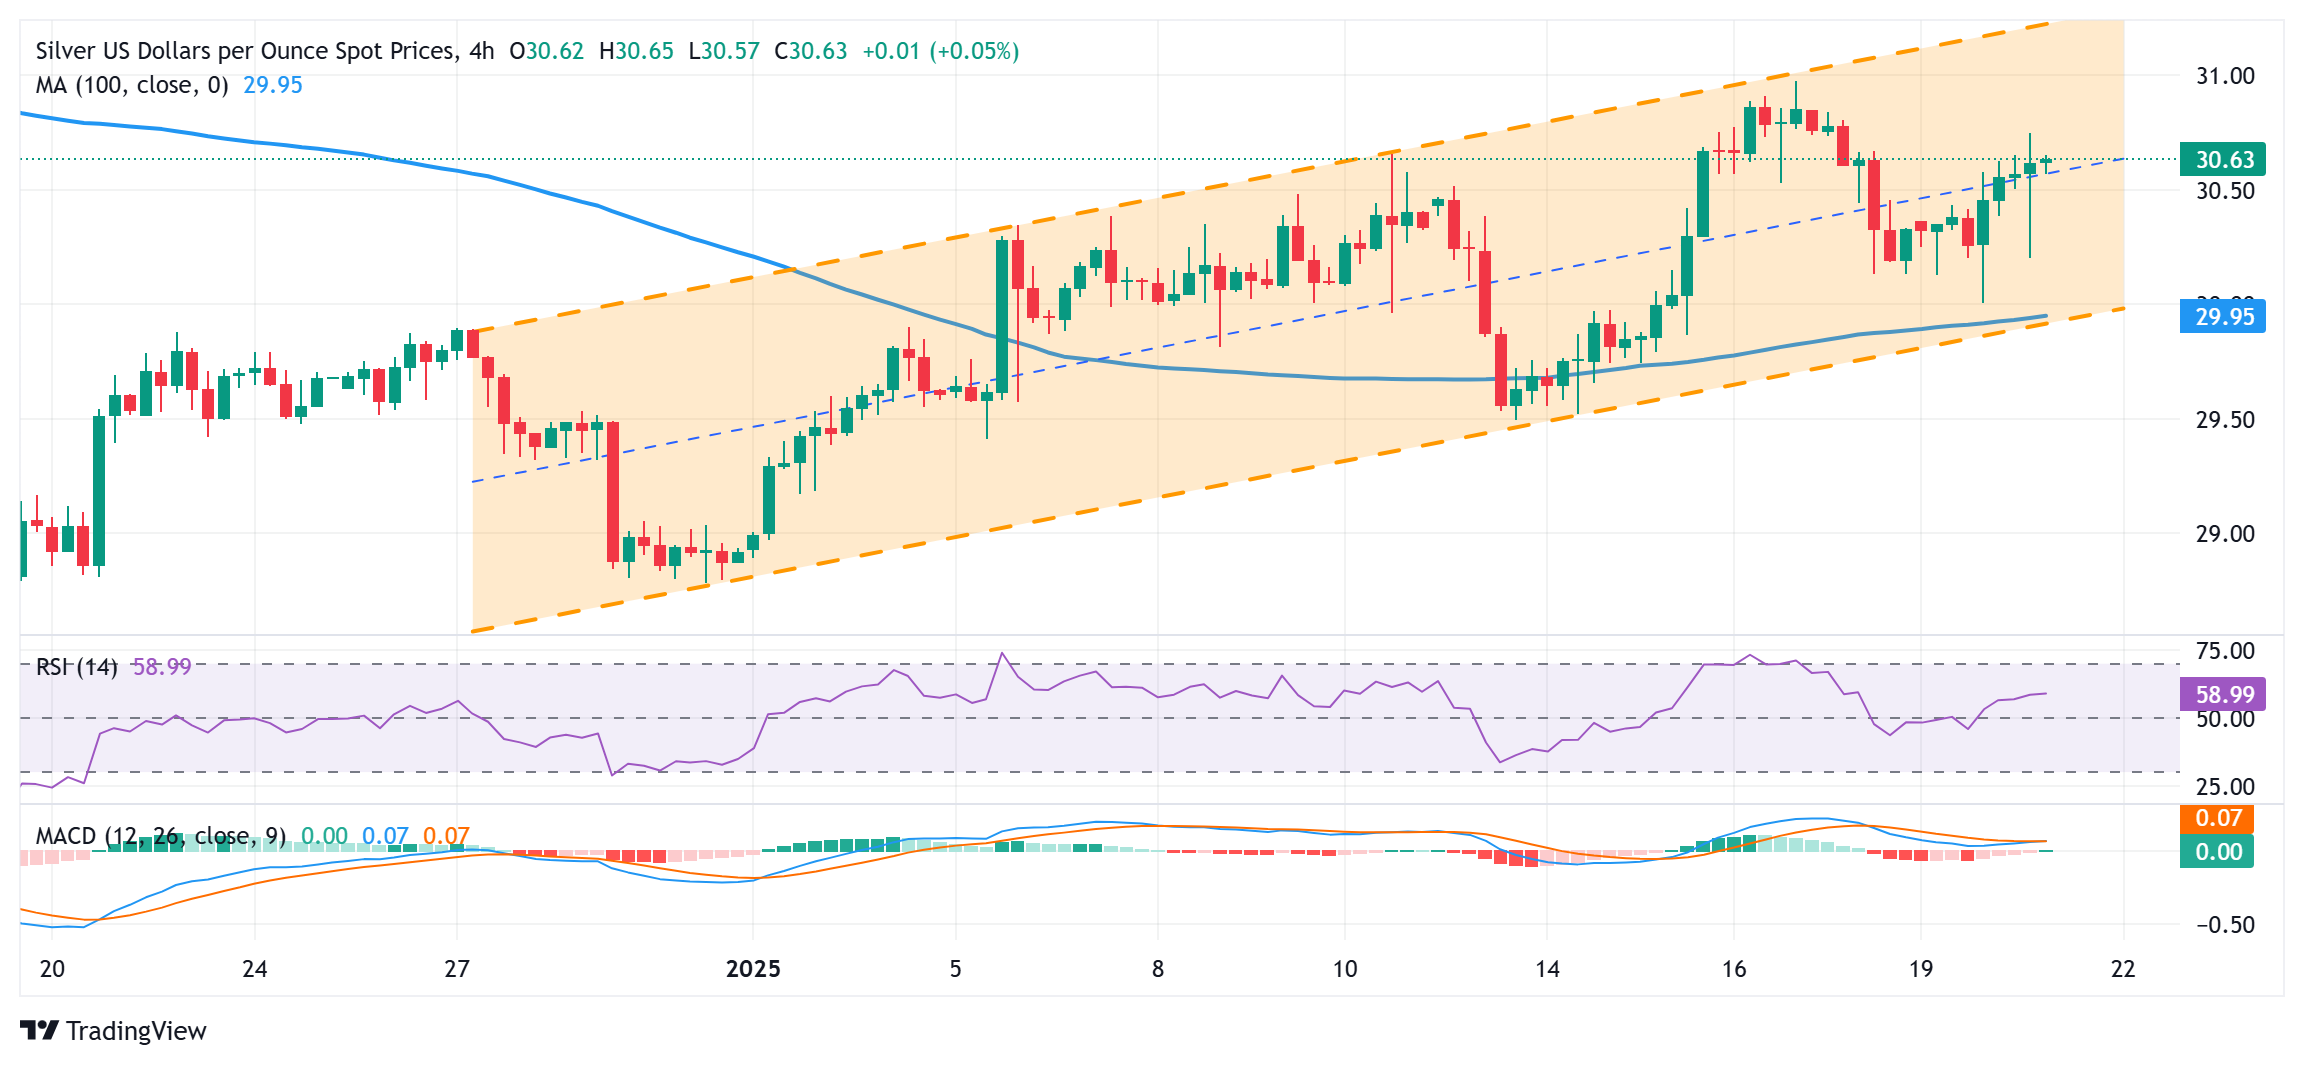
Looking at the broader picture, the recent move up witnessed over the past four weeks or so, from the $28.75-$28.70 region or a multi-month low touched in December, has been along an upward-sloping channel. This, along with the fact that oscillators on the daily chart have just started gaining positive traction, favors the XAG/USD bulls and supports prospects for a further near-term appreciating move towards the $31.00 mark.
A subsequent move up is likely to confront resistance near the top boundary of the aforementioned channel, currently pegged near the $31.25 region. A sustained breakout above the said barrier has the potential to lift the XAG/USD towards the $32.00 mark, with some intermediate hurdle near the $31.45-$31.50 region. The momentum could extend further towards the December swing high, around the $32.25-$32.30 area.
On the flip side, the $30.00 psychological mark – comprising the 100-period EMA on the 4-hour chart and the lower end of the ascending channel – might continue to act as immediate support. A convincing break below might shift the bias in favor of bearish traders and make the XAG/USD vulnerable to accelerate the fall towards the $29.50 region en route to the $29.00 mark and the $28.75-$28.70 region, or the multi-month low.
XAG/USD 4-hour chart
Silver FAQs
Silver is a precious metal highly traded among investors. It has been historically used as a store of value and a medium of exchange. Although less popular than Gold, traders may turn to Silver to diversify their investment portfolio, for its intrinsic value or as a potential hedge during high-inflation periods. Investors can buy physical Silver, in coins or in bars, or trade it through vehicles such as Exchange Traded Funds, which track its price on international markets.
Silver prices can move due to a wide range of factors. Geopolitical instability or fears of a deep recession can make Silver price escalate due to its safe-haven status, although to a lesser extent than Gold's. As a yieldless asset, Silver tends to rise with lower interest rates. Its moves also depend on how the US Dollar (USD) behaves as the asset is priced in dollars (XAG/USD). A strong Dollar tends to keep the price of Silver at bay, whereas a weaker Dollar is likely to propel prices up. Other factors such as investment demand, mining supply – Silver is much more abundant than Gold – and recycling rates can also affect prices.
Silver is widely used in industry, particularly in sectors such as electronics or solar energy, as it has one of the highest electric conductivity of all metals – more than Copper and Gold. A surge in demand can increase prices, while a decline tends to lower them. Dynamics in the US, Chinese and Indian economies can also contribute to price swings: for the US and particularly China, their big industrial sectors use Silver in various processes; in India, consumers’ demand for the precious metal for jewellery also plays a key role in setting prices.
Silver prices tend to follow Gold's moves. When Gold prices rise, Silver typically follows suit, as their status as safe-haven assets is similar. The Gold/Silver ratio, which shows the number of ounces of Silver needed to equal the value of one ounce of Gold, may help to determine the relative valuation between both metals. Some investors may consider a high ratio as an indicator that Silver is undervalued, or Gold is overvalued. On the contrary, a low ratio might suggest that Gold is undervalued relative to Silver.
Author

Haresh Menghani
FXStreet
Haresh Menghani is a detail-oriented professional with 10+ years of extensive experience in analysing the global financial markets.


