|

Silver Price Forecast: XAG/USD rises to $25.80 as US Dollar slips after steady US Job Openings

  • Silver price climbs above $25.50 as US Dollar’s rally stalls.
  • Investors remain risk-averse as Fed rate cut expectations ease.
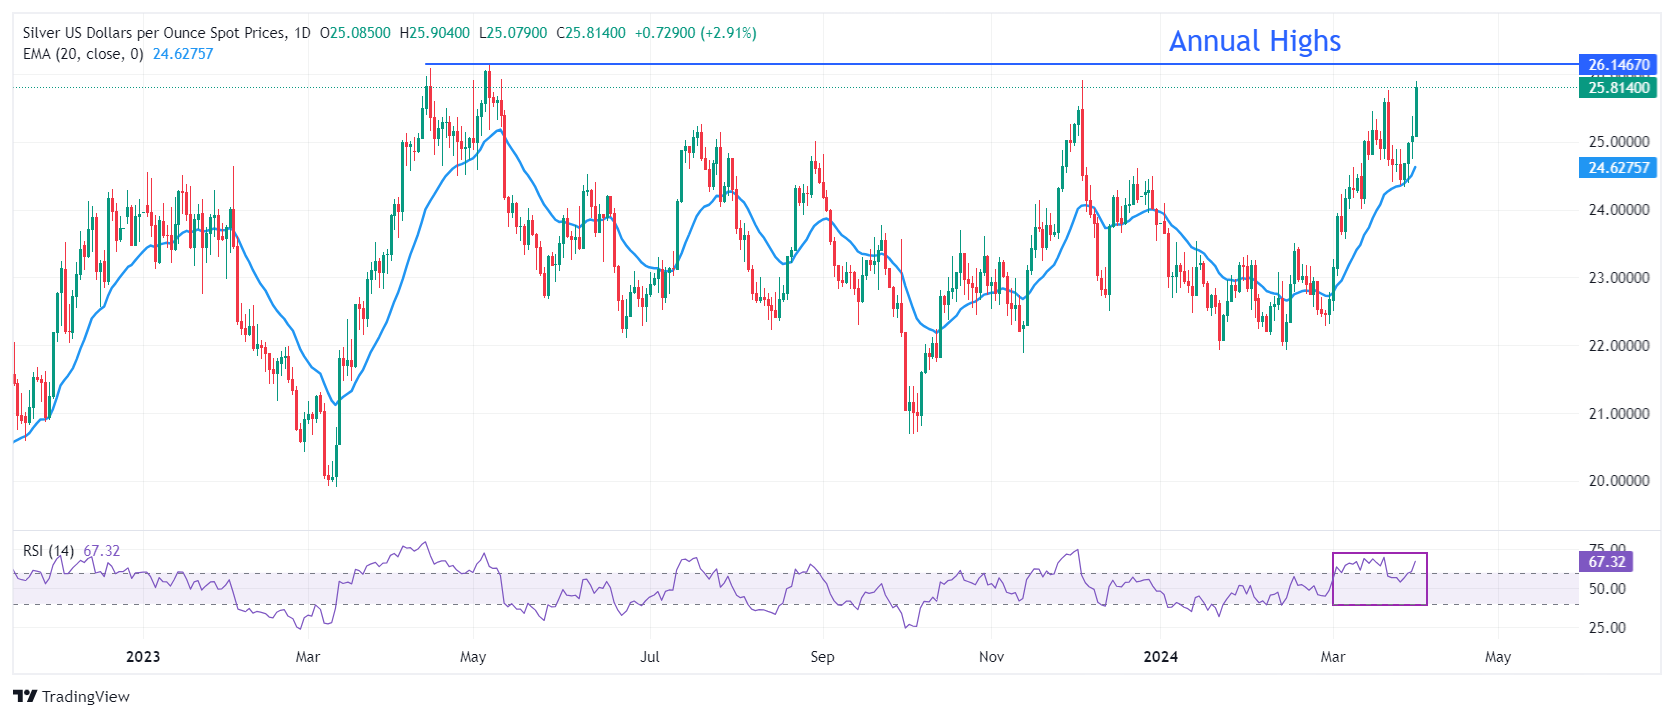
  • Silver price aims to recapture annual highs of $26.14.

Silver price (XAG/USD) jumps to $25.80 after the United States Bureau of Labor Statistics (BLS) reported steady United States JOLTS Job Opening figures for February. US employers posted 8.756 million, against expectations of 8.74 million, and the former release of 8.748 million. This indicates that the labor demand is steady.

The market sentiment is downbeat as the S&P 500 has opened on a negative note. Easing Federal Reserve (Fed) rate cut expectations for the June meeting has turned investors risk-averse. 10-year US Treasury yields soar to 4.40%. The US Dollar Index (DXY) dips to 104.70 after refreshing a four-month high at 105.10.

The US Dollar struggles to maintain strength despite the upbeat US Manufacturing PMI for March, which has strengthened the US economic outlook further. The Institute of Supply Management (ISM) reported that the Manufacturing PMI landed above the 50.0 threshold for the first time after contracting for 15 straight months.

This week, investors will focus on the US Nonfarm Payrolls (NFP) data for March, which will be published on Friday. The labor market data will provide fresh cues about when the Federal Reserve (Fed) will start reducing interest rates.

Silver technical analysis

Silver price is inch away from testing annual highs at $26.14, formed on May 5. The near-term demand for the white metal is bullish as the 20-day Exponential Moving Average (EMA) at $24.63 is sloping higher.

The 14-period Relative Strength Index (RSI) oscillates in the 60.00-80.00 range, indicating that the bullish momentum is intact.

Silver daily chart
XAG/USD

Overview
Today last price25.8
Today Daily Change0.72
Today Daily Change %2.87
Today daily open25.08
 
Trends
Daily SMA2024.64
Daily SMA5023.49
Daily SMA10023.58
Daily SMA20023.39
 
Levels
Previous Daily High25.38
Previous Daily Low24.75
Previous Weekly High25
Previous Weekly Low24.33
Previous Monthly High25.77
Previous Monthly Low22.51
Daily Fibonacci 38.2%25.14
Daily Fibonacci 61.8%24.99
Daily Pivot Point S124.76
Daily Pivot Point S224.43
Daily Pivot Point S324.12
Daily Pivot Point R125.4
Daily Pivot Point R225.71
Daily Pivot Point R326.04

Author

Sagar Dua

Sagar Dua

FXStreet

Sagar Dua is associated with the financial markets from his college days. Along with pursuing post-graduation in Commerce in 2014, he started his markets training with chart analysis.


More from Sagar Dua
Share:

Editor's Picks

AUD/USD remains offered around 0. 6950

AUD/USD has added to Wednesday’s decline, slipping back to the low 0.6900s just to grab some air afterwards and attempt a tepid bounce toward 0.6950 ahead of the opening bell in Asia on Friday. The Aussie’s extra weakness has come despite the Greenback receding modestly amid fresh improvement in the risk complex.

USD/JPY slips below 158.00 as USD retreats

USD/JPY returns to the red below 158.00 in the Asian session on Thursday amid speculation that authorities will step in to prop up the Japanese Yen. Meanwhile, the US Dollar eases from near an 18-month high on profit taking, ignoring Wednesday's hawkish FOMC Minutes and the risk of a further escalation of tensions in the Middle East, adding to the pair's pullback.

Gold clings to daily gains; still below $4,150

Gold regains some composure and climbs back to the vicinity $4,150 mark per troy ounce amid decent gains on Thursday. The yellow metal’s recovery follows some loss of momentum in the US Dollar strength and a decent drop in US Treasury yields across the curve.

XRP downtrend persists as EMA support strains while Binance reserves swell
Ripple (XRP) sellers are gaining ground on Thursday, as the token slips below $1.40. Sell-side pressure remains intense in the broader crypto market, as seen with leading digital assets, including Bitcoin (BTC) currently below $83,000 and Ethereum (ETH), sliding below $2,600. Despite the correction, XRP retains a constructive technical outlook, with support provided by a key moving average cluster.
Three fundamental drivers are all pushing the Euro south. This chart shows them lining up on 1.1000
EUR/USD has already fallen sharply, but the forces pushing the pair lower are becoming increasingly interconnected. French fiscal concerns, renewed energy pressure and an uncomfortable policy dilemma for the European Central Bank (ECB) are colliding with a US economy that continues to give the Federal Reserve (Fed) little reason to turn dovish.
The UK 30-year gilt just hit a 1998 high. Is that good or bad for the British Pound?
The yield on the UK's 30-year government bond, or gilt, went through 6% on October 1 for the first time since early 1998, and on Monday the Pound was at its strongest against the Euro since June 2025. The gilt market's 28-year high is mostly someone else's. Since early May, the 30-year gilt yield has risen about 0.15 of a percentage point and the US 30-year about 0.7.