Silver Price Forecast: XAG/USD retreats from $28 amid uncertainty ahead of US core PCE Inflation
- Silver price exhibits weakness with investors focusing on the US core PCE inflation for June.
- The Fed is expected to start reducing interest rates from the September meeting.
- China’s dismal economic outlook has dampened Silver’s demand as an industrial metal.

Silver price (XAG/USD) falls back after a short-lived pullback move to near $28.00 in Friday’s European session. The white metal remains in the bearish trajectory amid uncertainty over its demand as an industry metal globally.
The lackluster outcome of China’s Third Plenum, its weaker-than-expected Q2 Gross Domestic Product (GDP) growth, and an unexpected rate-cut decision by the People’s Bank of China (PBoC) have pointed to a slowdown in the world’s second-largest nation. This has raised concerns over the scale of business investment and consumer spending. Silver as a metal has applications in various industries such as renewable energy, electric vehicles (EVs), and electrical appliances etc.
Meanwhile, the uncertainty among investors ahead of the United States (US) core Personal Consumption Expenditure price index (PCE) data for May, which will be published at 12:30 GMT, has kept the Silver price on the backfoot.
The core PCE inflation data, a Federal Reserve’s (Fed) preferred inflation measure, is estimated to have decelerated to 2.5% from May’s reading of 2.8% year-on-year, with monthly price pressures growing steadily by 0.1%. The underlying inflation data will influence market expectations for rate cuts, which investors expect that the Federal Reserve (Fed) will start reducing in September.
Silver technical analysis
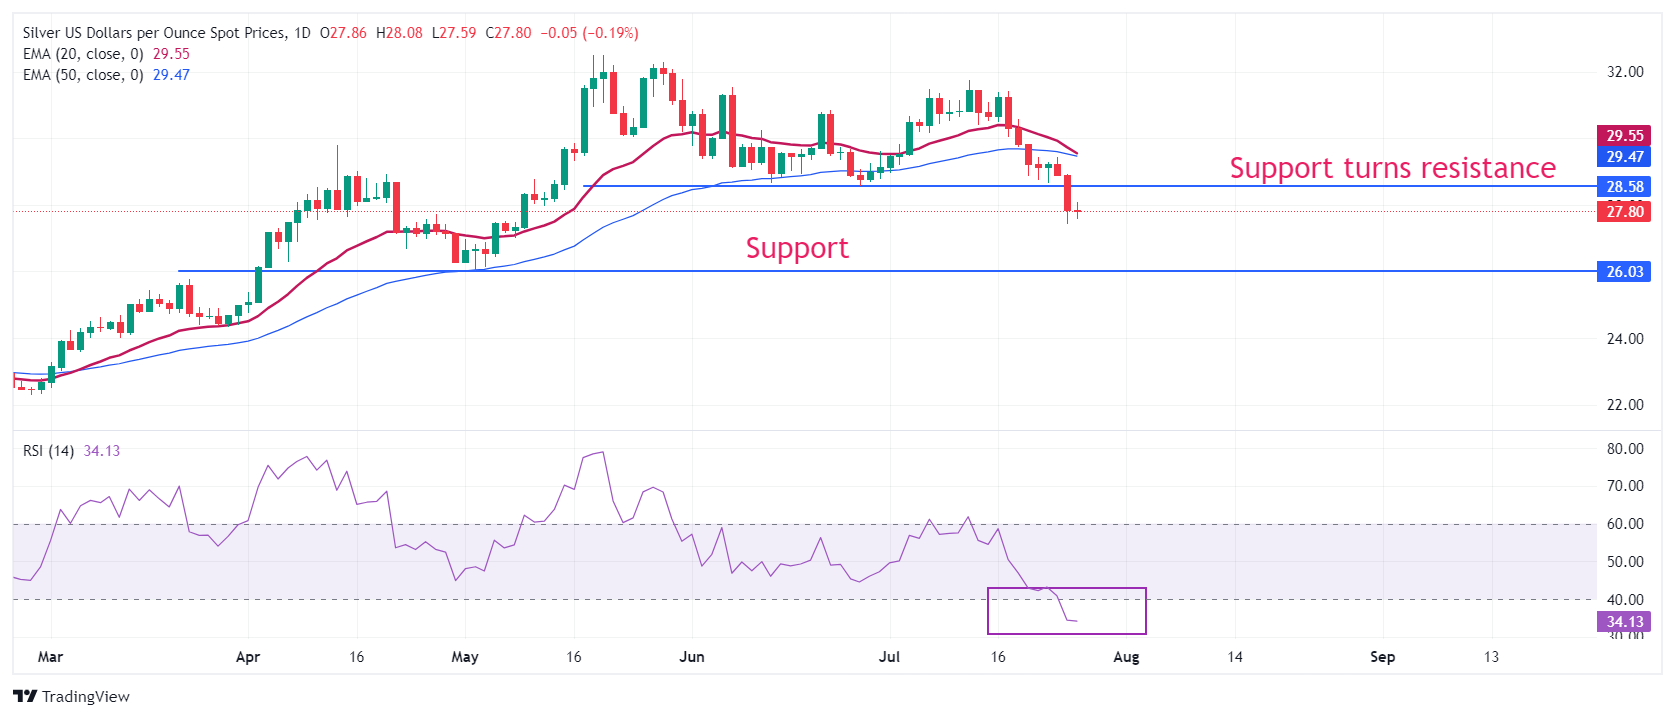
Silver price weakens after a breakdown below the horizontal support plotted from June 26 low at $28.57 on a daily timeframe. The near-term outlook of the Silver price appears to be uncertain as the 20- and 50-day Exponential Moving Averages (EMAs) are on the verge of delivering a bearish crossover near $29.50. On the downside, the asset will find support near May 2 low at $26.00.
The 14-day Relative Strength Index (RSI) shifts into the bearish range of 20.00-40.00, suggesting that a bearish momentum has been active.
Silver daily chart
Silver FAQs
Silver is a precious metal highly traded among investors. It has been historically used as a store of value and a medium of exchange. Although less popular than Gold, traders may turn to Silver to diversify their investment portfolio, for its intrinsic value or as a potential hedge during high-inflation periods. Investors can buy physical Silver, in coins or in bars, or trade it through vehicles such as Exchange Traded Funds, which track its price on international markets.
Silver prices can move due to a wide range of factors. Geopolitical instability or fears of a deep recession can make Silver price escalate due to its safe-haven status, although to a lesser extent than Gold's. As a yieldless asset, Silver tends to rise with lower interest rates. Its moves also depend on how the US Dollar (USD) behaves as the asset is priced in dollars (XAG/USD). A strong Dollar tends to keep the price of Silver at bay, whereas a weaker Dollar is likely to propel prices up. Other factors such as investment demand, mining supply – Silver is much more abundant than Gold – and recycling rates can also affect prices.
Silver is widely used in industry, particularly in sectors such as electronics or solar energy, as it has one of the highest electric conductivity of all metals – more than Copper and Gold. A surge in demand can increase prices, while a decline tends to lower them. Dynamics in the US, Chinese and Indian economies can also contribute to price swings: for the US and particularly China, their big industrial sectors use Silver in various processes; in India, consumers’ demand for the precious metal for jewellery also plays a key role in setting prices.
Silver prices tend to follow Gold's moves. When Gold prices rise, Silver typically follows suit, as their status as safe-haven assets is similar. The Gold/Silver ratio, which shows the number of ounces of Silver needed to equal the value of one ounce of Gold, may help to determine the relative valuation between both metals. Some investors may consider a high ratio as an indicator that Silver is undervalued, or Gold is overvalued. On the contrary, a low ratio might suggest that Gold is undervalued relative to Silver.
Author

Sagar Dua
FXStreet
Sagar Dua is associated with the financial markets from his college days. Along with pursuing post-graduation in Commerce in 2014, he started his markets training with chart analysis.


