Silver Price Forecast: XAG/USD recovers intraday losses after US Durable Goods Orders data
- Silver price rebounds after the release of the US Durable Goods Orders data for September.
- Fresh demand for US core goods contracted steadily by 0.8%.
- Improving market sentiment could dampen the appeal of safe-haven assets.

Silver price (XAG/USD) recovers its intraday losses after discovering buying interest near the key support of $33.00 in Friday’s New York session. The white metal rebounds after the release of the United States (US) Durable Goods Orders for September, which showed that fresh demand for long-lasting goods declined steadily by 0.8%. However, the pace at which Durable Goods Orders contracted was slower than estimates of 1.0%.
The US Dollar (USD) edged lower after the release of the Durable Goods Orders data, with the US Dollar Index (DXY) struggling to hold 104.00. 10-year US Treasury yields fall to near 4.19%. Lower yields on interest-bearing assets reduce the opportunity cost of holding an investment in non-yielding assets, such as Silver.
The Silver price faced pressure in the last two trading sessions amid profit-booking after it posted a fresh high close to $35 on Tuesday, the highest level seen in over 12 years.
Meanwhile, an improvement in investors’ risk appetite could weigh on the Silver price. The market sentiment has improved as investors start digesting expectations that former US President Donald Trump will win over current Vice President Kamala Harris in national elections on November 5. The S&P 500 has opened on a positive note on Friday.
Also, the visit of US Secretary of State Antony Blinken to Saudi Arabia has slightly renewed hopes of a ceasefire in the war between Iran and Israel in southern cities of Lebanon.
Silver technical analysis
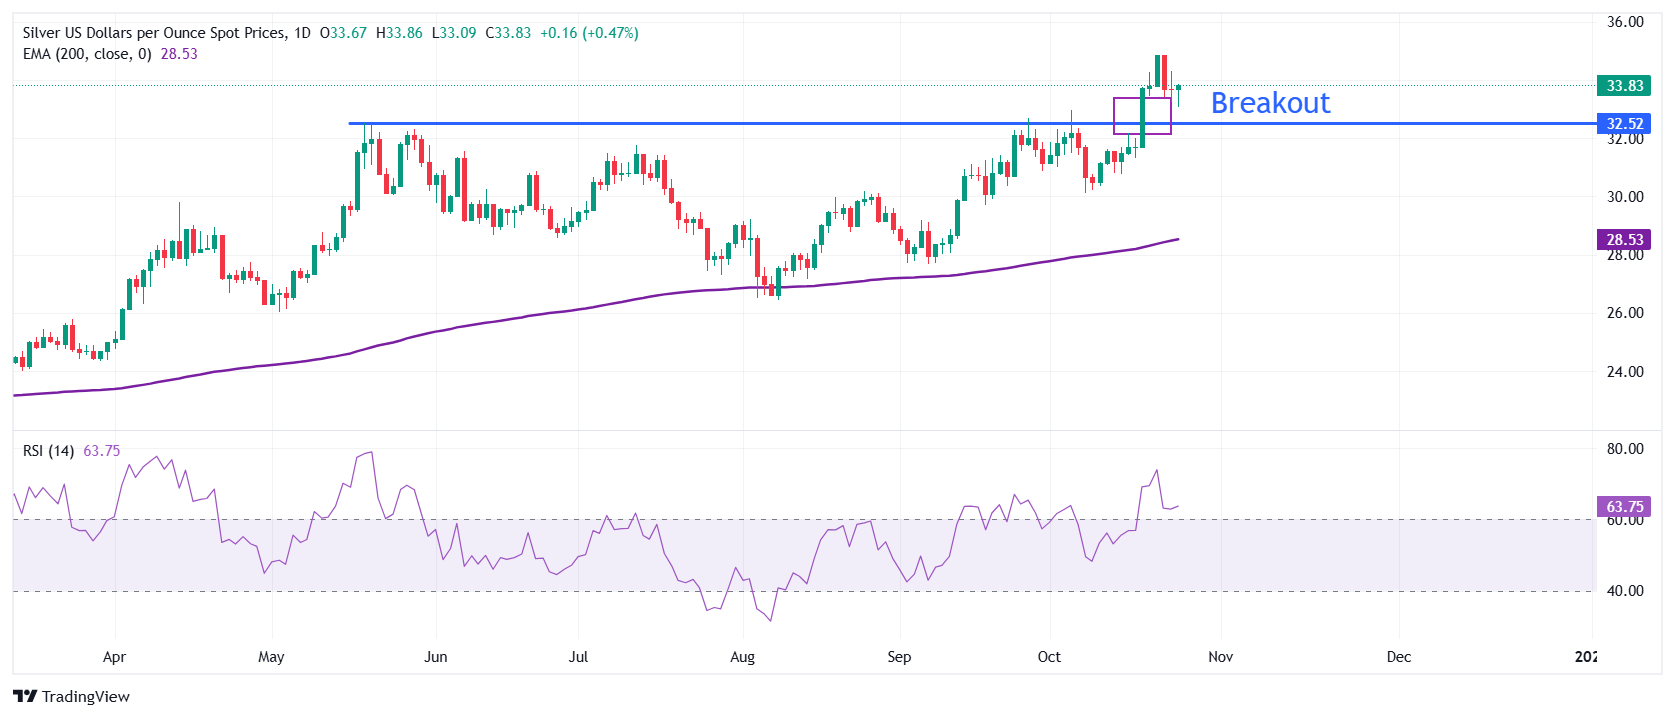
Silver price bounces back from 33.00 in North American trading hours on Friday. The white metal aims to revisit a fresh over 12-year high near $35.00. The asset strengthened after breaking above the horizontal resistance plotted from May 21 high of $32.50 on a daily timeframe, which will act as a support for now. Upward-sloping 20- and 50-day Exponential Moving Averages (EMAs) near $32.30 and $31.10, respectively, signal more upside ahead.
The 14-day Relative Strength Index (RSI) oscillates above 60.00, points to an active bullish momentum.
Silver daily chart
Silver FAQs
Silver is a precious metal highly traded among investors. It has been historically used as a store of value and a medium of exchange. Although less popular than Gold, traders may turn to Silver to diversify their investment portfolio, for its intrinsic value or as a potential hedge during high-inflation periods. Investors can buy physical Silver, in coins or in bars, or trade it through vehicles such as Exchange Traded Funds, which track its price on international markets.
Silver prices can move due to a wide range of factors. Geopolitical instability or fears of a deep recession can make Silver price escalate due to its safe-haven status, although to a lesser extent than Gold's. As a yieldless asset, Silver tends to rise with lower interest rates. Its moves also depend on how the US Dollar (USD) behaves as the asset is priced in dollars (XAG/USD). A strong Dollar tends to keep the price of Silver at bay, whereas a weaker Dollar is likely to propel prices up. Other factors such as investment demand, mining supply – Silver is much more abundant than Gold – and recycling rates can also affect prices.
Silver is widely used in industry, particularly in sectors such as electronics or solar energy, as it has one of the highest electric conductivity of all metals – more than Copper and Gold. A surge in demand can increase prices, while a decline tends to lower them. Dynamics in the US, Chinese and Indian economies can also contribute to price swings: for the US and particularly China, their big industrial sectors use Silver in various processes; in India, consumers’ demand for the precious metal for jewellery also plays a key role in setting prices.
Silver prices tend to follow Gold's moves. When Gold prices rise, Silver typically follows suit, as their status as safe-haven assets is similar. The Gold/Silver ratio, which shows the number of ounces of Silver needed to equal the value of one ounce of Gold, may help to determine the relative valuation between both metals. Some investors may consider a high ratio as an indicator that Silver is undervalued, or Gold is overvalued. On the contrary, a low ratio might suggest that Gold is undervalued relative to Silver.
Author

Sagar Dua
FXStreet
Sagar Dua is associated with the financial markets from his college days. Along with pursuing post-graduation in Commerce in 2014, he started his markets training with chart analysis.


