Silver Price Forecast: XAG/USD rebounds above $31 as fears of escalation in Russia-Ukraine war


  • Silver price recovers mildly above $31.00 on heightened geopolitical tensions.
  • Ukraine launched UK-supplied missiles in Russia, resulting in a fresh escalation in the war.
  • Investors await the flash US S&P Global PMI for November.

Silver price (XAG/USD) bounces back slightly above $31.00 in Thursday’s North American session after a corrective to near $30.80 on Wednesday. The white metal rebounds on fresh escalation in the Russia-Ukraine war, which forced investors to flee to safe-haven assets, such as Silver.

Geopolitical tensions renewed as Ukraine launched United Kingdom (UK)-supplied missiles into Russia, a day after it fired Army Tactical Missile System (ATACMS) provided by United States (US) President Joe Biden that fuelled risks of third world war.

Historically, the appeal of safe-haven assets, such as Silver, improves in times of uncertainty or heightened geopolitical risks.

The outlook of the Silver price remains uncertain as investors doubt whether the Federal Reserve (Fed) will cut interest rates again in the December meeting. The probability of the Fed to cut interest rates by 25 bps to 4.25%-4.50% in December has come down to 56% from 72% a week ago, according to the CME FedWatch tool.

Meanwhile, the US Dollar Index (DXY), which tracks the Greenback’s value against six major currencies, wobbles around 106.60. 10-year US Treasury yields hover around 4.40%.

Going forward, investors will focus on the preliminary S&P Global PMI data for November, which will be published on Friday. Economists expect the overall private sector activity to have improved.

Silver technical analysis

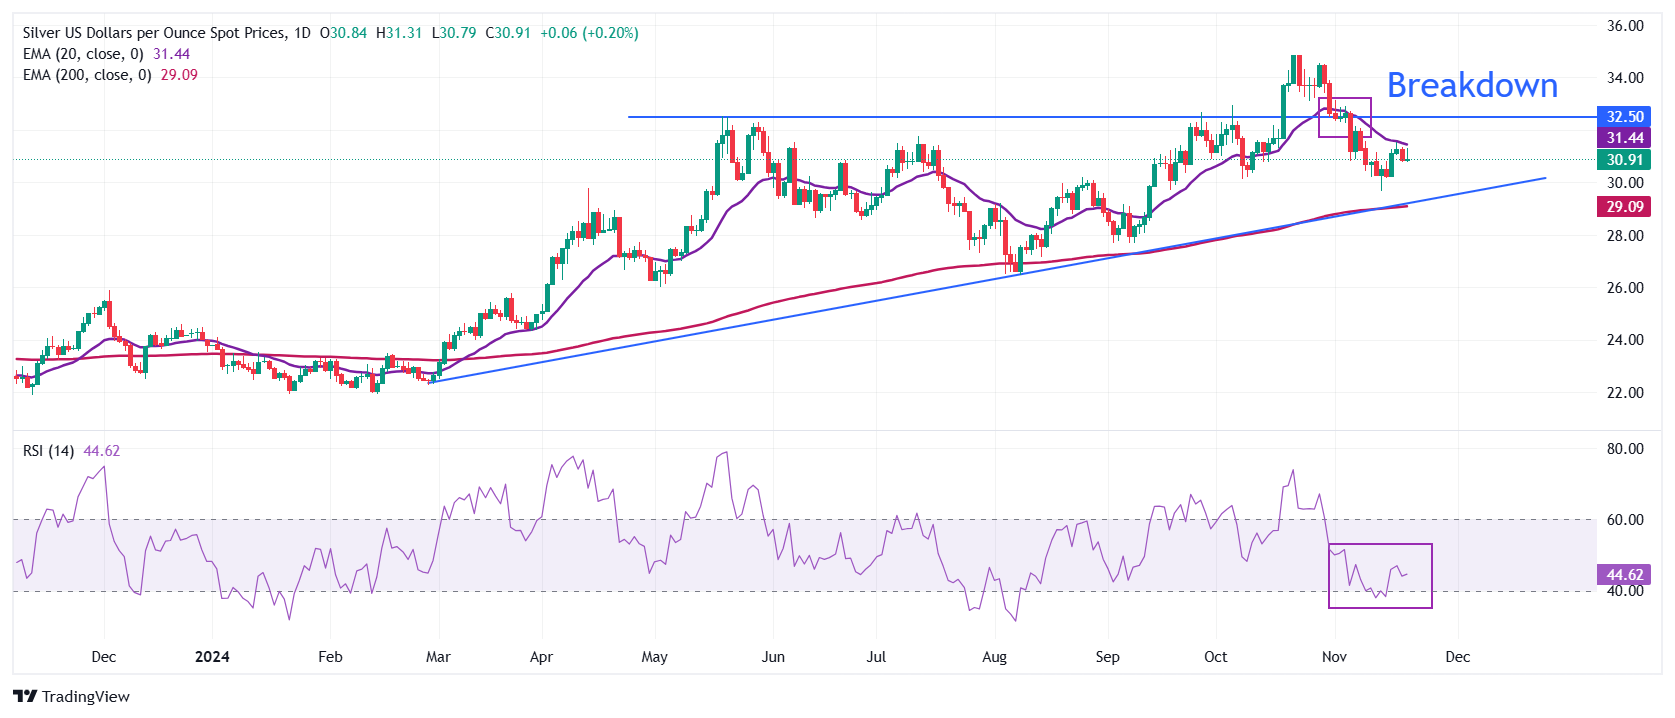
Silver price stays on track toward the upward-sloping trendline around $29.00, plotted from the February low of $22.30, which also coincides with the 200-day Exponential Moving Average (EMA). The white metal faces selling pressure near the 20-day EMA, which trades around $31.40.

The asset weakened after the breakdown of the horizontal support plotted from the May 21 high of $32.50.

The 14-day Relative Strength Index (RSI) slides to near 40.00. A bearish momentum will trigger if the RSI (14) sustains below the same.

Silver daily chart

Silver FAQs

Silver is a precious metal highly traded among investors. It has been historically used as a store of value and a medium of exchange. Although less popular than Gold, traders may turn to Silver to diversify their investment portfolio, for its intrinsic value or as a potential hedge during high-inflation periods. Investors can buy physical Silver, in coins or in bars, or trade it through vehicles such as Exchange Traded Funds, which track its price on international markets.

Silver prices can move due to a wide range of factors. Geopolitical instability or fears of a deep recession can make Silver price escalate due to its safe-haven status, although to a lesser extent than Gold's. As a yieldless asset, Silver tends to rise with lower interest rates. Its moves also depend on how the US Dollar (USD) behaves as the asset is priced in dollars (XAG/USD). A strong Dollar tends to keep the price of Silver at bay, whereas a weaker Dollar is likely to propel prices up. Other factors such as investment demand, mining supply – Silver is much more abundant than Gold – and recycling rates can also affect prices.

Silver is widely used in industry, particularly in sectors such as electronics or solar energy, as it has one of the highest electric conductivity of all metals – more than Copper and Gold. A surge in demand can increase prices, while a decline tends to lower them. Dynamics in the US, Chinese and Indian economies can also contribute to price swings: for the US and particularly China, their big industrial sectors use Silver in various processes; in India, consumers’ demand for the precious metal for jewellery also plays a key role in setting prices.

Silver prices tend to follow Gold's moves. When Gold prices rise, Silver typically follows suit, as their status as safe-haven assets is similar. The Gold/Silver ratio, which shows the number of ounces of Silver needed to equal the value of one ounce of Gold, may help to determine the relative valuation between both metals. Some investors may consider a high ratio as an indicator that Silver is undervalued, or Gold is overvalued. On the contrary, a low ratio might suggest that Gold is undervalued relative to Silver.


Share: Feed news

Information on these pages contains forward-looking statements that involve risks and uncertainties. Markets and instruments profiled on this page are for informational purposes only and should not in any way come across as a recommendation to buy or sell in these assets. You should do your own thorough research before making any investment decisions. FXStreet does not in any way guarantee that this information is free from mistakes, errors, or material misstatements. It also does not guarantee that this information is of a timely nature. Investing in Open Markets involves a great deal of risk, including the loss of all or a portion of your investment, as well as emotional distress. All risks, losses and costs associated with investing, including total loss of principal, are your responsibility. The views and opinions expressed in this article are those of the authors and do not necessarily reflect the official policy or position of FXStreet nor its advertisers. The author will not be held responsible for information that is found at the end of links posted on this page.

If not otherwise explicitly mentioned in the body of the article, at the time of writing, the author has no position in any stock mentioned in this article and no business relationship with any company mentioned. The author has not received compensation for writing this article, other than from FXStreet.

FXStreet and the author do not provide personalized recommendations. The author makes no representations as to the accuracy, completeness, or suitability of this information. FXStreet and the author will not be liable for any errors, omissions or any losses, injuries or damages arising from this information and its display or use. Errors and omissions excepted.

The author and FXStreet are not registered investment advisors and nothing in this article is intended to be investment advice.

XM
Account
7.2
Tools
9.2
Service
9.4
Trading
9.0
Trust
7.0
Experience
8.4
Read review
Moneta Markets
Account
7.4
Tools
6.6
Service
8.0
Trading
6.6
Trust
5.2
Experience
9.2
Read review
Trading Pro
Account
7.2
Tools
5.2
Service
6.6
Trading
8.0
Trust
5.0
Experience
7.0
Read review
Pepperstone
Account
8.2
Tools
8.2
Service
7.4
Trading
9.0
Trust
8.8
Experience
9.0
Read review
XM
Read review
Moneta Markets
Read review
Trading Pro
Read review
Pepperstone
Read review
Trading Pro
Read review
Pepperstone
Read review
XM
Read review
Moneta Markets
Read review
Trading Pro
Account
7.2
Tools
5.2
Service
6.6
Trading
8.0
Trust
5.0
Experience
7.0
Read review
Pepperstone
Account
8.2
Tools
8.2
Service
7.4
Trading
9.0
Trust
8.8
Experience
9.0
Read review
XM
Account
7.2
Tools
9.2
Service
9.4
Trading
9.0
Trust
7.0
Experience
8.4
Read review
Moneta Markets
Account
7.4
Tools
6.6
Service
8.0
Trading
6.6
Trust
5.2
Experience
9.2
Read review

Recommended content


Recommended content

Editors’ Picks

EUR/USD remains offered in the low-1.0900s

EUR/USD remains offered in the low-1.0900s

The generalised selling pressure continues to weigh on the risk complex, pushing EUR/USD back toward the 1.0900 support level amid a growing risk-off mood, as traders assess President Trump’s reciprocal tariffs and their impact on economic activity.

EUR/USD News
GBP/USD retreats further and breaks below 1.2800

GBP/USD retreats further and breaks below 1.2800

The US Dollar is picking up extra pace and flirting with daily highs, sending GBP/USD to multi-week lows near 1.2770 in a context where safe-haven demand continues to dictate sentiment amid the chaos of US tariffs.

GBP/USD News
Gold slips back below the $3,000 mark

Gold slips back below the $3,000 mark


Gold has turned lower, slipping beneath the key $3,000 mark per troy ounce amid a broad sell-off across global equity markets. The decline in the precious metal may reflect investors unwinding long positions in gold to offset mounting losses in stocks.

Gold News
Solana Price Forecast: Bears gain momentum as SOL falls below $100

Solana Price Forecast: Bears gain momentum as SOL falls below $100

Solana (SOL) extends its loss by over 7% and falls below the $100 mark at the time of writing on Monday after crashing 15.15% last week. Coinglass data shows that SOL’s leveraged traders wiped out nearly $70 million in liquidations in the last 24 hours.

Read more
Strategic implications of “Liberation Day”

Strategic implications of “Liberation Day”

Liberation Day in the United States came with extremely protectionist and inward-looking tariff policy aimed at just about all U.S. trading partners. In this report, we outline some of the more strategic implications of Liberation Day and developments we will be paying close attention to going forward.

Read more
The Best brokers to trade EUR/USD

The Best brokers to trade EUR/USD

SPONSORED Discover the top brokers for trading EUR/USD in 2025. Our list features brokers with competitive spreads, fast execution, and powerful platforms. Whether you're a beginner or an expert, find the right partner to navigate the dynamic Forex market.

Read More

Forex MAJORS

Cryptocurrencies

Signatures

Best Brokers of 2025