Silver Price Forecast: XAG/USD posts fresh weekly high at $29.20 as US labor market cools down
- Silver price refreshes weekly high at $29.20 as weak US NFP data sends US yields down.
- The US NFP report showed that labor demand has slowed and wage growth has softened.
- Investors see the Fed pivoting to policy normalization in September.

Silver price (XAG/USD) posts a fresh weekly high at $29.20 in Friday’s North American trading hours. The white metal gains as US yields sink after the United States (US) Nonfarm Payrolls (NFP) report for July showed signs of cooling labor market conditions.
10-year US Treasury yields witness a bloodbath and dives to multi-month low near 3.82%. The US Dollar Index (DXY), which tracks the Greenback’s value against six major currencies, plunges below 103.30. Lower yields on interest-bearing assets bode strongly for the Gold price as they reduce the opportunity cost of investment in non-yielding assets.
The report showed that labor demand has softened as number of individuals hired by employers in July came in lower at 114K than estimates of 175K and June’s reading of 179K. The Unemployment Rate jumps to 4.3%, the highest since November 2021, from expectations and the prior release of 4.1%. The report clearly indicates that the labor market struggles to bear the consequences of higher interest rates by the Federal Reserve (Fed).
Meanwhile, Average Hourly Earnings have also grown at a slower pace, pointing to a slowdown in consumer spending that eventually cools down inflationary pressures. Annually, the wage growth measure decelerated at a faster-than-expected pace to 3.6%. While the labor market has cooled down, it will add to reasons prompting expectations of sooner rate cuts by the Fed. The Fed is widely anticipated to start reducing interest rates from the September meeting.
Silver technical analysis
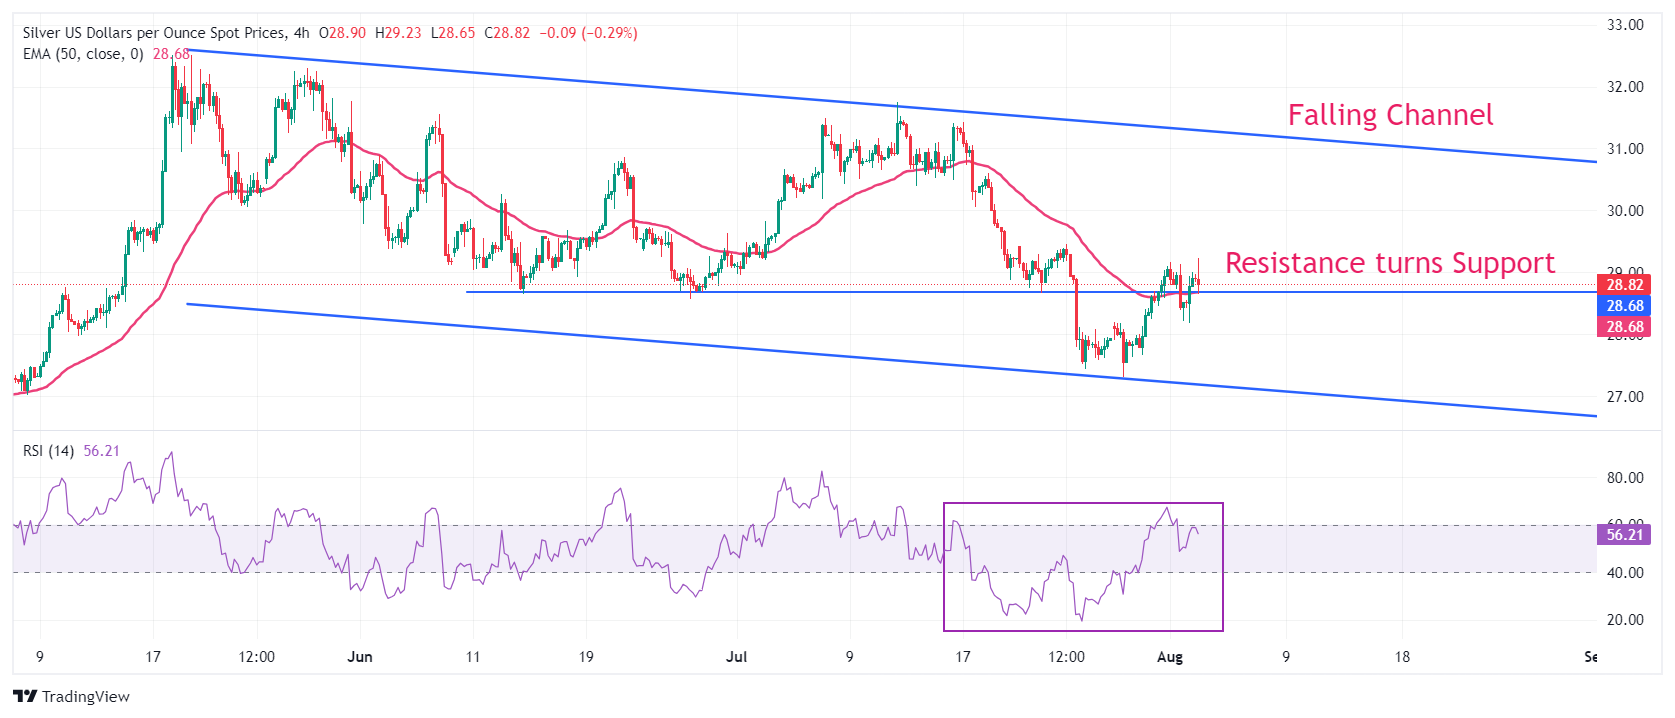
Silver price breaks above the horizontal resistance plotted from June 13 low at $28.66 on a four-hour timeframe, which has become a support now. The asset climbs above the 50-period Exponential Moving Average (EMA) near $28.70, suggesting that the near-term trend is upbeat.
The 14-period Relative Strength Index (RSI) moves higher to near 60.00. If the RSI breaks above 60.00, the momentum will shift to the upside.
Silver four-hour chart
Silver FAQs
Silver is a precious metal highly traded among investors. It has been historically used as a store of value and a medium of exchange. Although less popular than Gold, traders may turn to Silver to diversify their investment portfolio, for its intrinsic value or as a potential hedge during high-inflation periods. Investors can buy physical Silver, in coins or in bars, or trade it through vehicles such as Exchange Traded Funds, which track its price on international markets.
Silver prices can move due to a wide range of factors. Geopolitical instability or fears of a deep recession can make Silver price escalate due to its safe-haven status, although to a lesser extent than Gold's. As a yieldless asset, Silver tends to rise with lower interest rates. Its moves also depend on how the US Dollar (USD) behaves as the asset is priced in dollars (XAG/USD). A strong Dollar tends to keep the price of Silver at bay, whereas a weaker Dollar is likely to propel prices up. Other factors such as investment demand, mining supply – Silver is much more abundant than Gold – and recycling rates can also affect prices.
Silver is widely used in industry, particularly in sectors such as electronics or solar energy, as it has one of the highest electric conductivity of all metals – more than Copper and Gold. A surge in demand can increase prices, while a decline tends to lower them. Dynamics in the US, Chinese and Indian economies can also contribute to price swings: for the US and particularly China, their big industrial sectors use Silver in various processes; in India, consumers’ demand for the precious metal for jewellery also plays a key role in setting prices.
Silver prices tend to follow Gold's moves. When Gold prices rise, Silver typically follows suit, as their status as safe-haven assets is similar. The Gold/Silver ratio, which shows the number of ounces of Silver needed to equal the value of one ounce of Gold, may help to determine the relative valuation between both metals. Some investors may consider a high ratio as an indicator that Silver is undervalued, or Gold is overvalued. On the contrary, a low ratio might suggest that Gold is undervalued relative to Silver.
Author

Sagar Dua
FXStreet
Sagar Dua is associated with the financial markets from his college days. Along with pursuing post-graduation in Commerce in 2014, he started his markets training with chart analysis.


