|

Silver Price Forecast: XAG/USD nosedives below $30 as strong US NFP report boosts US yields

  • Silver price drops vertically below $30.00 as US yields soar after upbeat US NFP report for May.
  • Both job and wage growth beat estimates.
  • Pause in PBoC’s gold-buying also weighed on the Silver price.

Silver price (XAG/USD) plummets below the psychological support of $30.00 in Friday’s New York session. The white metal plunges after the United States Nonfarm Payrolls (NFP) report May showed that labor demand remains robust and the wage growth momentum was stronger than expected.

Fresh payrolls came in higher at 272K than expectations of 185K and the prior release of 165K. Average Hourly Earnings rose strongly by 0.4% from the estimates of 0.3% and the former release of 0.2% on a month-on-month basis. Average Hourly Earnings data is a measure of wage inflation, which directs households’ spendings. Annual wage inflation measure grew by 4.1%, beats the estimate of 3.9% and April’s read of 4.0%.

Strong payrolls and wage growth data prompt the need to maintain a restrictive interest rate framework by the Federal Reserve (Fed) for a longer period, which is a favourable situation for yields on interest-bearing assets and the US Dollar. 10-year US Treasury yields rally 4.43%, up by 3.5% from Thursday’s close. The US Dollar Index (DXY), which tracks the Greenback’s value against six major currencies, jumps to 104.80. Higher yields on interest-bearing assets increase the opportunity cost of holding an investment in non-yielding assets, such as Silver.

The white metal was already under pressure as People’s Bank of China’s (PBoC) gold reserves report for May showed that their 18-month long Gold buying spell paused for a while. The report showed that gold reserves were unchanged at 72.80 million fine troy oz.

Silver technical analysis

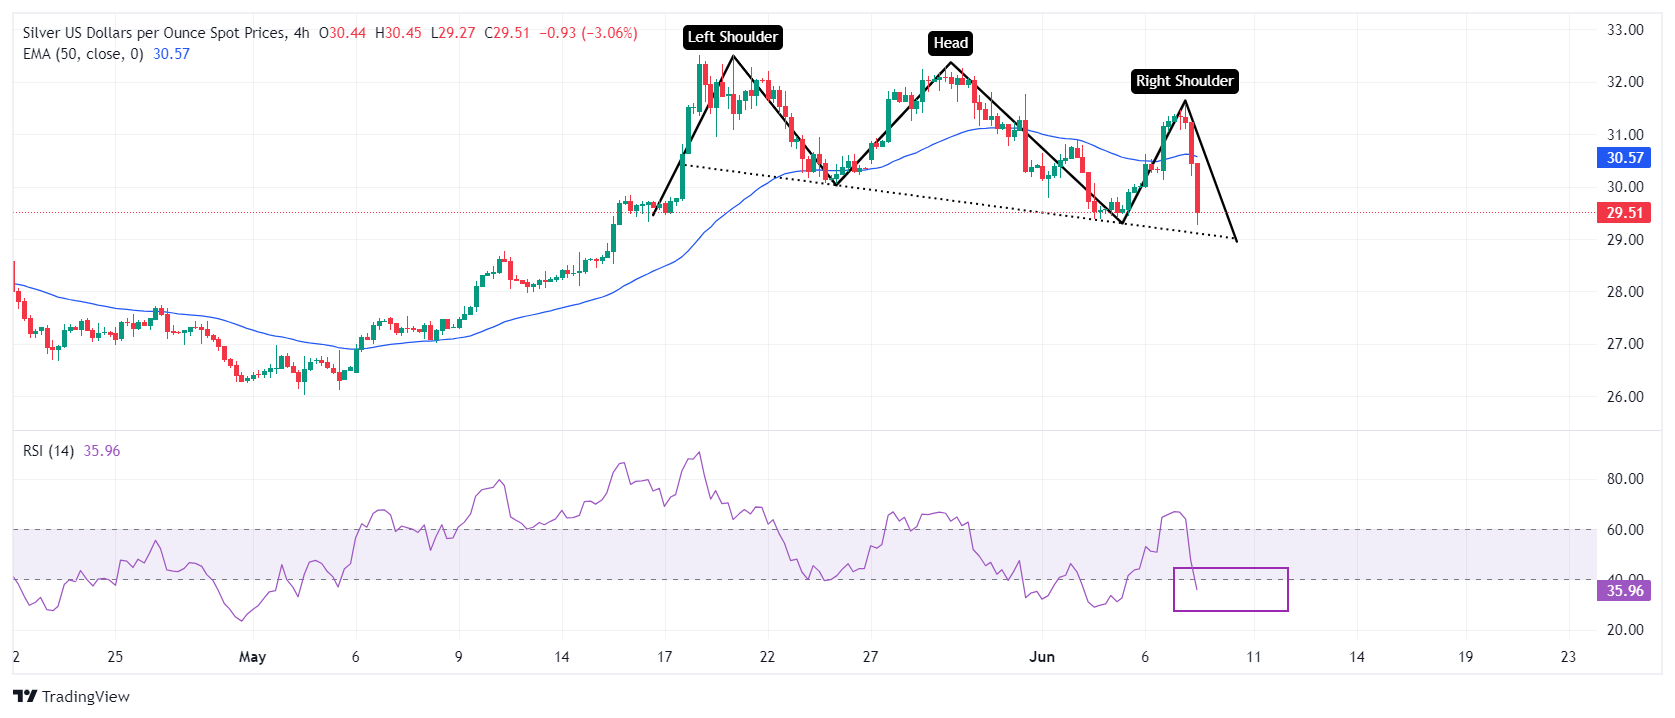
Selling pressure in the Silver price indicates that it could deliver a breakdown of the Head and Shoulder chart pattern formed on a four-hour timeframe. The neckline of the above-mentioned chart pattern appears to be around $29.00. A decisive break below the same would result in a bearish reversal.

Spot prices have dropped below the 50-period Exponential Moving Average (EMA) near $30.50, suggesting that the near-term outlook turns bearish.

The 14-period Relative Strength Index (RSI) has slipped below 40.00. A sustained move below the same will push the momentum towards the downside.

Silver four-hour chart
XAG/USD

Overview
Today last price29.49
Today Daily Change-1.83
Today Daily Change %-5.84
Today daily open31.32
 
Trends
Daily SMA2030.49
Daily SMA5028.6
Daily SMA10025.99
Daily SMA20024.61
 
Levels
Previous Daily High31.35
Previous Daily Low29.97
Previous Weekly High32.3
Previous Weekly Low30.19
Previous Monthly High32.51
Previous Monthly Low26.02
Daily Fibonacci 38.2%30.82
Daily Fibonacci 61.8%30.5
Daily Pivot Point S130.41
Daily Pivot Point S229.5
Daily Pivot Point S329.04
Daily Pivot Point R131.78
Daily Pivot Point R232.25
Daily Pivot Point R333.16

Author

Sagar Dua

Sagar Dua

FXStreet

Sagar Dua is associated with the financial markets from his college days. Along with pursuing post-graduation in Commerce in 2014, he started his markets training with chart analysis.


More from Sagar Dua
Share:

Editor's Picks

GBP/USD stays positive near 1.3450 after UK jobs data

GBP/USD recovers ground and tests 1.3450 in early Europe on Tuesday. The UK ILO Unemployment Rate remained at 4.9% in the three months to May, compared with expectations of 5%, but fails to provide any impetus to the British Pound's renewed uptick. Traders stay cautious amid US-Iran uncertainty and the UK political transition.

EUR/USD steadies above 1.1400, awaits German ZEW Survey

EUR/USD is consolidating above the 1.1400 mark in European trading on Tuesday. The pair lacks any directional impetus amid a subdued US Dollar price action and ahead of the German ZEW Survey.


Gold: Acceptance above 21-day SMA at $4,065 is critical for buyers

Gold is building on its recovery from two-week lows of $4,024 reached last Friday, extending the winning streak into a third straight day on Tuesday. XAU/USD is capitalizing on the ongoing pullback in Oil prices from monthly highs near $84.50. The black gold is retreating for a second day in a row on emerging signs of diplomatic efforts to ease the US-Iran conflict.

Shiba Inu price extends gains as on-chain and derivatives metrics confirm bullish bias

Shiba Inu extends gains, trading above $0.0000042 after breaking above the descending trendline the previous day. Strengthening on-chain data and improving derivatives metrics support further gains for the meme coin. CryptoQuant’s exchange netflow chart below shows five consecutive days of net outflows since July 17.

Brent nears a critical crossroads as the global economy faces one too
Markets spent last Friday digesting a Reuters report that Iran has told the Houthis to stand ready to close Bab el-Mandeb if the US strikes Iranian power infrastructure — missiles and drones are reportedly already positioned near the strait, awaiting the order from IRGC officers in Yemen.
US Dollar mid-year outlook: Exceptional currency, exceptional risks?
The US Dollar enters the second half of 2026 in a markedly different position from a year ago. The King currency has recovered, reflecting persistent US inflation, changing expectations for Fed policy, geopolitical tensions and renewed demand for defensive assets.














