Silver Price Forecast: XAG/USD jumps higher above $30 as Fed Powell prompts optimism on rate cuts
- Silver price surges to near $30.50 as unexpectedly weak US ADP Employment data weighs on the US Dollar.
- Fed Powell admitted slight progress in inflation.
- Investors await the US ISM Services PMI and the FOMC minutes.

Silver price (XAG/USD) rallies to near $30.50 in Wednesday’s American session. The white metal strengthens as the US Dollar (USD) fell on the backfoot after Federal Reserve (Fed) Chair Jerome Powell said in the European Central Bank (ECB) Forum on Central Banking on Tuesday that recent data suggests the United States (US) economy has returned on the disinflationary path.
Fed Powell acknowledged that the central bank has made quiet a bit progress on inflation. In spite of that policymakers want to see inflation declining for months before lowering interest rates. The US Dollar Index (DXY), which tracks the Greenback’s value against six major currencies, corrects further to near 105.50. 10-year US Treasury yields decline to near 4.42%. Lower yields on interest-bearing assets and the US Dollar reduce the opportunity cost of holding an investment in non-yielding assets, such as Silver.
Meanwhile, investors turn uncertain over labor market conditions as private payrolls unexpectedly dropped in June. The ADP Employment report showed that fresh payrolls came in at 150K. Economists forecasted them to have remained slightly higher at 160K than the prior release of 152K.
Going forward, investors will focus on the US ISM Services PMI for June and the Federal Open Market Committee (FOMC) minutes of the June meeting.
Silver technical analysis
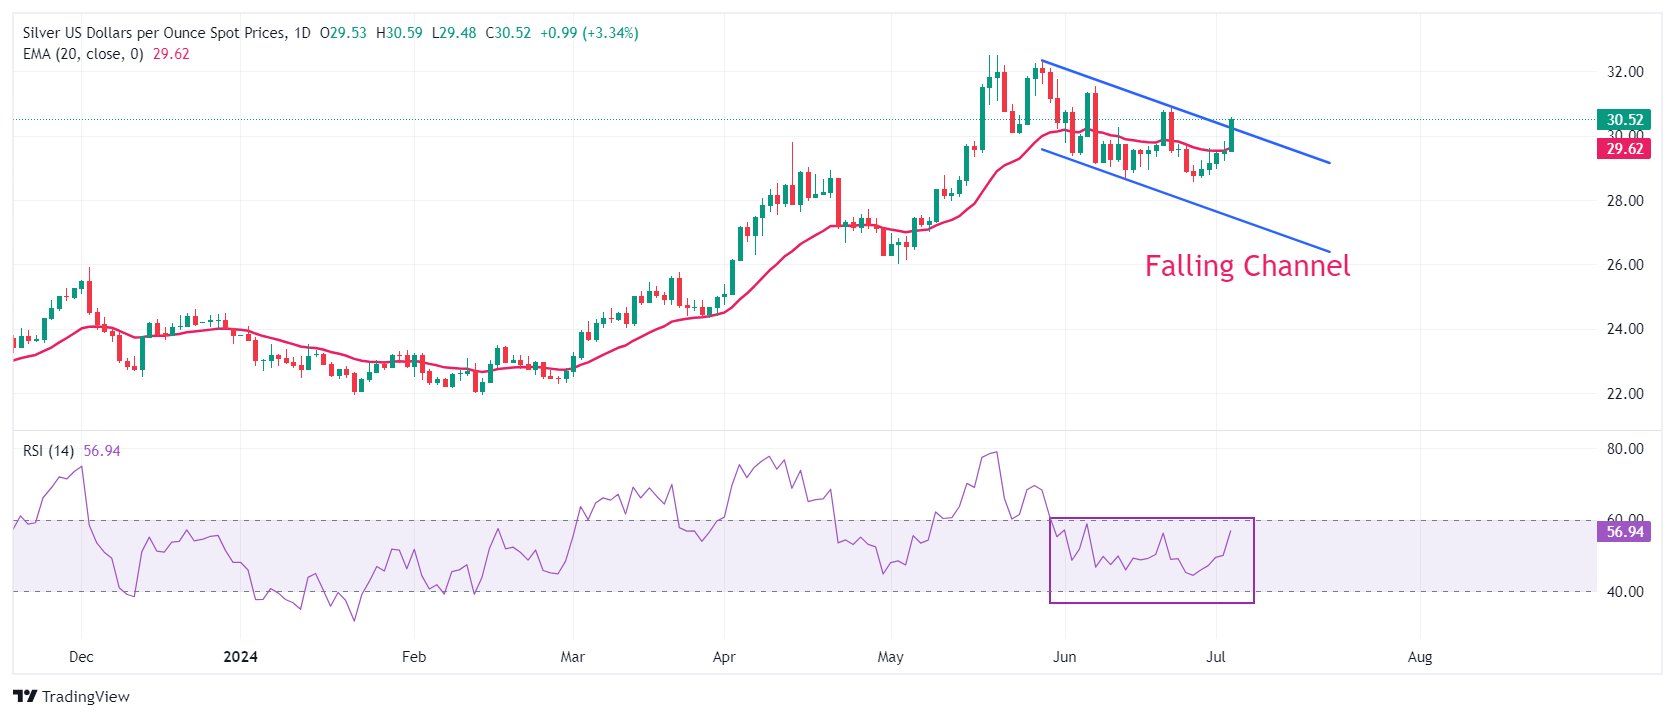
Silver price attempts to deliver a breakout of the Falling Channel chart formation on a daily timeframe. This suggests that a corrective move in the Silver price has now concluded and it has resumed its upside journey.
The white metal climbs above the 20-day Exponential Moving Average (EMA) near $29.60, suggesting that the near-term trend is bullish.
The 14-period Relative Strength Index (RSI) approaches 60.00. A decisive break above the same would shift momentum towards the upside.
Silver daily chart
(This story was corrected at 13:10 GMT on Wednesday to say in the first paragraph that "The white metal strengthens as the US Dollar (USD) fell on the backfoot" not weakens)
Economic Indicator
ADP Employment Change
The ADP Employment Change is a gauge of employment in the private sector released by the largest payroll processor in the US, Automatic Data Processing Inc. It measures the change in the number of people privately employed in the US. Generally speaking, a rise in the indicator has positive implications for consumer spending and is stimulative of economic growth. So a high reading is traditionally seen as bullish for the US Dollar (USD), while a low reading is seen as bearish.
Read more.Last release: Wed Jul 03, 2024 12:15
Frequency: Monthly
Actual: 150K
Consensus: 160K
Previous: 152K
Source: ADP Research Institute
Traders often consider employment figures from ADP, America’s largest payrolls provider, report as the harbinger of the Bureau of Labor Statistics release on Nonfarm Payrolls (usually published two days later), because of the correlation between the two. The overlaying of both series is quite high, but on individual months, the discrepancy can be substantial. Another reason FX traders follow this report is the same as with the NFP – a persistent vigorous growth in employment figures increases inflationary pressures, and with it, the likelihood that the Fed will raise interest rates. Actual figures beating consensus tend to be USD bullish.
Author

Sagar Dua
FXStreet
Sagar Dua is associated with the financial markets from his college days. Along with pursuing post-graduation in Commerce in 2014, he started his markets training with chart analysis.


