Silver Price Forecast: XAG/USD holds onto gains near $32 on mounting Fed large rate cut bets
- Silver price clings to gains near $32.00 as Fed large rate cut bets swell.
- The next move in the US Dollar will be guided by the US core PCE inflation data.
- Silver price aims to recapture the decade-high of $32.50.

Silver price (XAG/USD) grips gains near the key resistance of $32.00 in Wednesday’s New York session. The white metal holds strength as the US Dollar remains under pressure amid growing speculation that the Federal Reserve (Fed) will deliver another sizable interest rate cut in any of the remaining two policy meetings this year.
The US Dollar Index (DXY), which tracks the Greenback’s value against six major currencies, hovers near the yearly low of 100.20. Meanwhile, 10-year US Treasury yields jump to near 3.77%. Historically, higher yields on interest-bearing assets increase the opportunity cost of holding an investment in non-yielding assets, such as Silver. But, in this case, the Silver price remains firm.
According to the CME FedWatch tool, the central bank is expected to reduce its key borrowing rates further by 75 bps in the remainder of the year, suggesting that there will be one 50 bps and one 25 bps rate cut. 30-day Federal fund futures pricing data shows that the probability of the Fed reducing interest rates by a larger-than-usual margin in November has increased to 59% from 37% a week ago.
Going forward, investors will focus on the United States (US) core Personal Consumption Expenditure price index (PCE) data for August, a Fed’s preferred inflation gauge, which will be published on Friday. Economists estimate the annual inflation measure to have accelerated to 2.7% from 2.6% in July.
Silver technical analysis
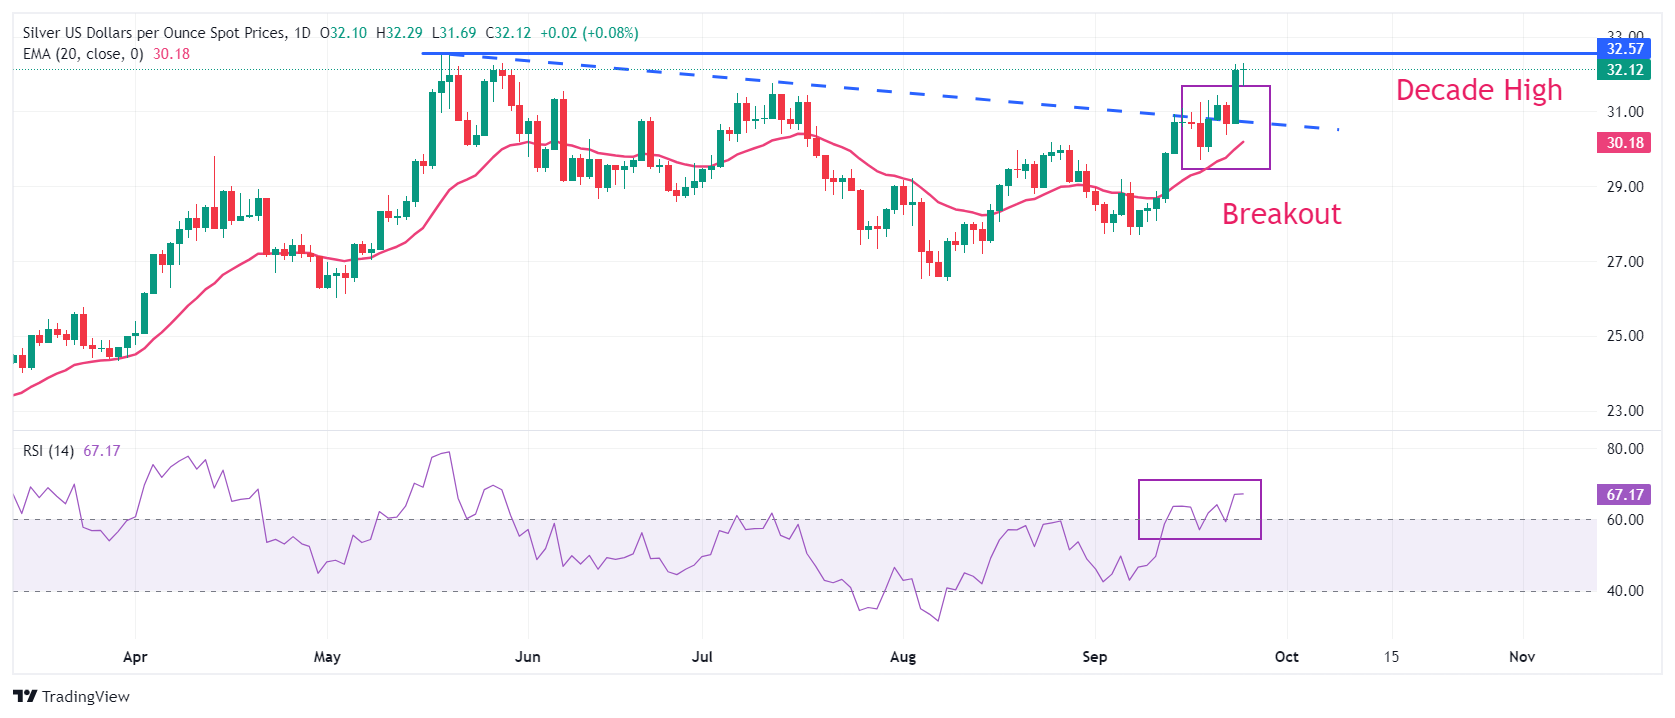
Silver price approaches the decade high of $32.50. The white metal strengthened after the breakout of the downward-sloping trendline from May 21 high of $32.50. Upward-sloping 20-day Exponential Moving Average (EMA) near $30.20 suggests that the near-term outlook of the Silver price is bullish.
The 14-day Relative Strength Index (RSI) strives to sustain in the 60.00-80.00. A bullish momentum would trigger if the oscillator manages to do so.
Silver daily chart
Silver FAQs
Silver is a precious metal highly traded among investors. It has been historically used as a store of value and a medium of exchange. Although less popular than Gold, traders may turn to Silver to diversify their investment portfolio, for its intrinsic value or as a potential hedge during high-inflation periods. Investors can buy physical Silver, in coins or in bars, or trade it through vehicles such as Exchange Traded Funds, which track its price on international markets.
Silver prices can move due to a wide range of factors. Geopolitical instability or fears of a deep recession can make Silver price escalate due to its safe-haven status, although to a lesser extent than Gold's. As a yieldless asset, Silver tends to rise with lower interest rates. Its moves also depend on how the US Dollar (USD) behaves as the asset is priced in dollars (XAG/USD). A strong Dollar tends to keep the price of Silver at bay, whereas a weaker Dollar is likely to propel prices up. Other factors such as investment demand, mining supply – Silver is much more abundant than Gold – and recycling rates can also affect prices.
Silver is widely used in industry, particularly in sectors such as electronics or solar energy, as it has one of the highest electric conductivity of all metals – more than Copper and Gold. A surge in demand can increase prices, while a decline tends to lower them. Dynamics in the US, Chinese and Indian economies can also contribute to price swings: for the US and particularly China, their big industrial sectors use Silver in various processes; in India, consumers’ demand for the precious metal for jewellery also plays a key role in setting prices.
Silver prices tend to follow Gold's moves. When Gold prices rise, Silver typically follows suit, as their status as safe-haven assets is similar. The Gold/Silver ratio, which shows the number of ounces of Silver needed to equal the value of one ounce of Gold, may help to determine the relative valuation between both metals. Some investors may consider a high ratio as an indicator that Silver is undervalued, or Gold is overvalued. On the contrary, a low ratio might suggest that Gold is undervalued relative to Silver.
Author

Sagar Dua
FXStreet
Sagar Dua is associated with the financial markets from his college days. Along with pursuing post-graduation in Commerce in 2014, he started his markets training with chart analysis.


