|

Silver Price Forecast: XAG/USD holds $29 with eyes on US Inflation and Fed’s policy outcome

  • Silver price hovers above $29.00 ahead of eventful New York session.
  • The US CPI data will be followed by the Fed’s policy, which will provide cues about when the central bank will return to policy normalization.
  • Fed’s dot plot is expected to show fewer rate cuts than three forecasted in March.

Silver price (XAG/USD) steadies above its crucial support of $29.00 in Wednesday’s European session. The white metal is little changed ahead of the United States (US) Consumer Price Index (CPI) data for May and the Federal Reserve’s (Fed) interest rate decision, which are scheduled in the North American session.

Also, the US Dollar and bond yields pause as investors brace for crucial events. The US Dollar Index (DXY), which tracks the Greenback’s value against six major currencies, edges down to 105.20. 10-year US Treasury Yields steady near 4.40%.

Investors will pay close attention to the US inflation to know whether the progress in the disinflation process has resumed. The CPI data expectedly decelerated in April after remaining stubbornly higher in the first quarter of the year.

Meanwhile, the Fed is expected to remain status quo for the seventh straight time. The major trigger for global markets will be the Fed’s dot plot that indicates where policymakers see Federal fund rates heading in medium and longer-term timeframe.

The dot plot is expected to show fewer rate cuts this year from March’s forecast, given strong labor market conditions and weak confidence of officials on progress in the disinflation process.  

Silver technical analysis

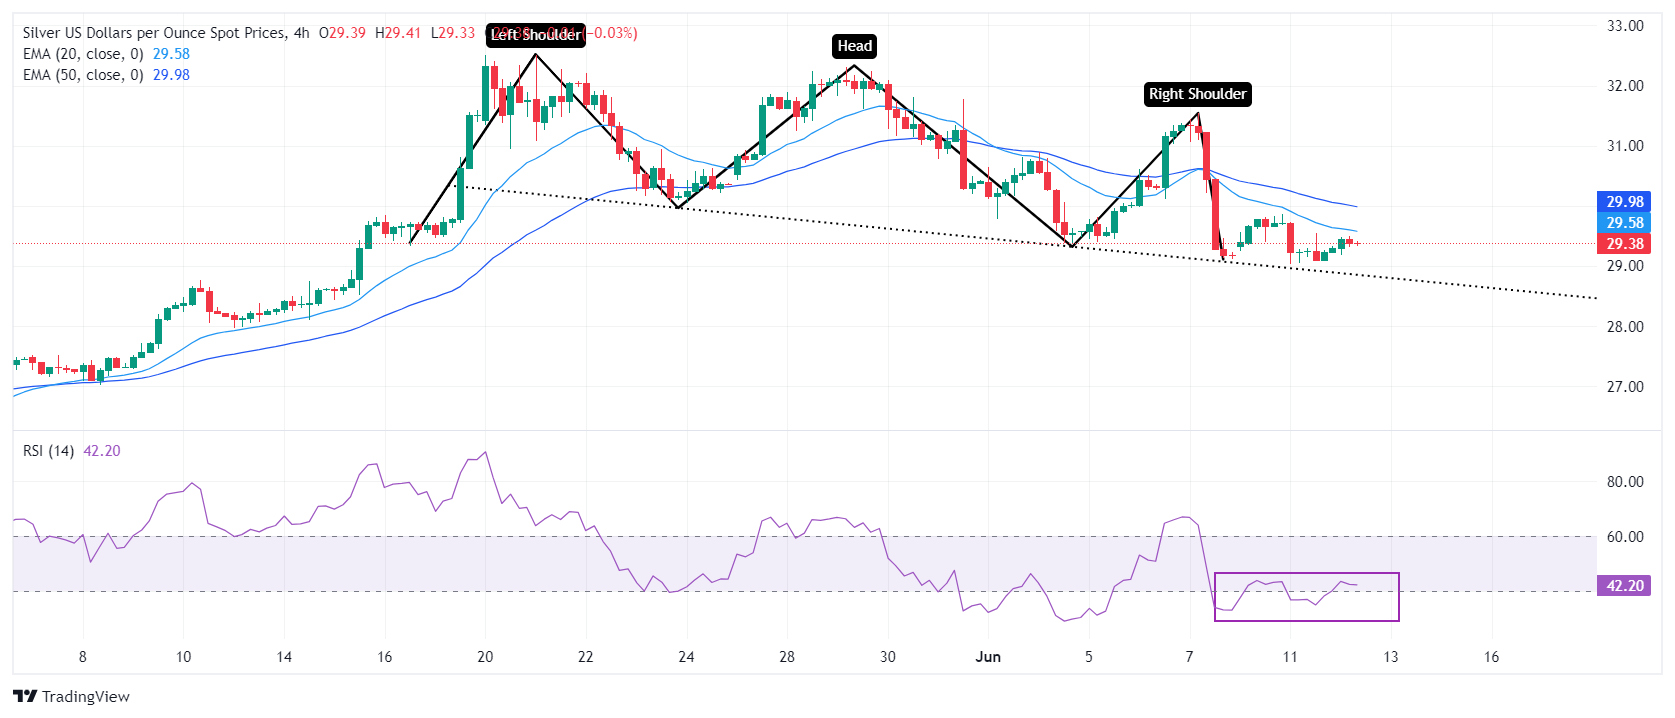
Silver price trades inside Thursday’s trading range, exhibiting indecisiveness among market participants. The asset trades close to the neckline of the Head and Shoulder (H&S) chart pattern, which is marked from April 9 high at 1.0885 on a four-hour timeframe. A breakdown of the above-mentioned chart pattern results in a bearish reversal.

The near-term outlook remains uncertain as 20 and 50-day Exponential Moving Averages (EMAs) near $30.00 and $29.60, respectively, are declining.

The 14-period Relative Strength Index (RSI) hovers near 40.00. A bearish momentum would trigger if it breaks below the same.

Silver four-hour chart

XAG/USD

Overview
Today last price29.38
Today Daily Change0.10
Today Daily Change %0.34
Today daily open29.28
 
Trends
Daily SMA2030.65
Daily SMA5028.84
Daily SMA10026.2
Daily SMA20024.69
 
Levels
Previous Daily High29.86
Previous Daily Low29.04
Previous Weekly High31.55
Previous Weekly Low29.12
Previous Monthly High32.51
Previous Monthly Low26.02
Daily Fibonacci 38.2%29.35
Daily Fibonacci 61.8%29.55
Daily Pivot Point S128.92
Daily Pivot Point S228.56
Daily Pivot Point S328.09
Daily Pivot Point R129.75
Daily Pivot Point R230.22
Daily Pivot Point R330.58

Author

Sagar Dua

Sagar Dua

FXStreet

Sagar Dua is associated with the financial markets from his college days. Along with pursuing post-graduation in Commerce in 2014, he started his markets training with chart analysis.

More from Sagar Dua
Share:

Editor's Picks

EUR/USD eyes nine-day EMA barrier after rebounding from 1.1600

EUR/USD gains ground after registering modest losses in the previous session, trading around 1.1620 during the Asian hours on Friday. The technical analysis of the daily chart suggests an ongoing bearish bias as the pair remains within the descending channel pattern.

GBP/USD: Pound Sterling ticks up against US Dollar in countdown to US NFP

The Pound Sterling trades marginally higher to near 1.3365 against the US Dollar during the Asian trading session on Friday. The GBP/USD pair edges up as the US Dollar ticks down ahead of the United States Nonfarm Payrolls data for February, which will be published at 13:30 GMT.

Gold awaits US Nonfarm Payrolls for a clear directional impetus

Gold rebounds above $5,100 early Friday after testing the $5,050 level amid global sell-off. The US Dollar pulls back as profit-taking creeps in ahead of US labor data. For February. 21-day SMA holds amid bullish RSI; a daily closing above 61.8% Fibo is critical for Gold buyers.

Ethereum pull in $169M as validators pile in to stake ETH

US spot Ethereum exchange-traded funds recorded $169 million in net inflows on Wednesday, marking the largest daily intake in two months, according to SoSoValue data. The rise in inflows signals renewed institutional interest in Ethereum amid broader market volatility.

The market compass is pointing at a barrel of Oil

The Asian open is arriving with equities leaning the wrong way, and the reason is not complicated. The market’s compass needle has snapped firmly toward crude. In this tape, oil is not just another input price; it is the gravitational center around which every asset class is orbiting.

Ripple tests recovery strength amid steady ETF inflows, growing retail interest

Ripple (XRP) continues to demonstrate notable resilience as the cryptocurrency market navigates the persistent war in the Middle East after the United States (US) and Israel attacked Iran on Saturday.