Silver Price Forecast: XAG/USD edges higher but remains on backfoot with US NFP in focus
- Silver price remains on edge as traders brace for the US NFP data for October.
- Lower US Initial Jobless Claims data signaled an improvement in job demand.
- The US Dollar resumes its upside journey after a corrective move.

Silver price (XAG/USD) adds little gains in European trading hours on Friday after plunging to near $32.50 on Thursday. The white metal faced sharp selling pressure after the release of the United States (US) Initial Jobless Claims data for the week ending October 25, which came in lowest in almost 22 weeks.
The US Department of Labor showed that individuals claiming jobless benefits for the first time were 216K, lower than estimates of 230K and the former reading of 228K. A slowdown in the jobless claims’ growth pointed to an improving labor demand environment. On Wednesday, the ADP Employment Change data also showed a strong labor requirement in the private sector. The agency reported that 233K workers were hired by the private sector in October, significantly higher than 159K in September.
Meanwhile, the US Dollar Index (DXY), which gauges Greenback’s value against six major currencies, rebounds strongly to 104.10 after a corrective move to 103.80. 10-year US Treasury yields climb to near 4.30%.
For more interest rate cues, investors await the US Nonfarm Payrolls (NFP) data for October, which will be published at 12:30 GMT. The NFP report is expected to show that the economy added 113K new workers, significantly less than 254K in September. Economists expect the Unemployment Rate to have remained steady at 4.1%. The NFP data will significantly influence market expectations for the Federal Reserve (Fed) interest rate cut path.
Silver technical analysis
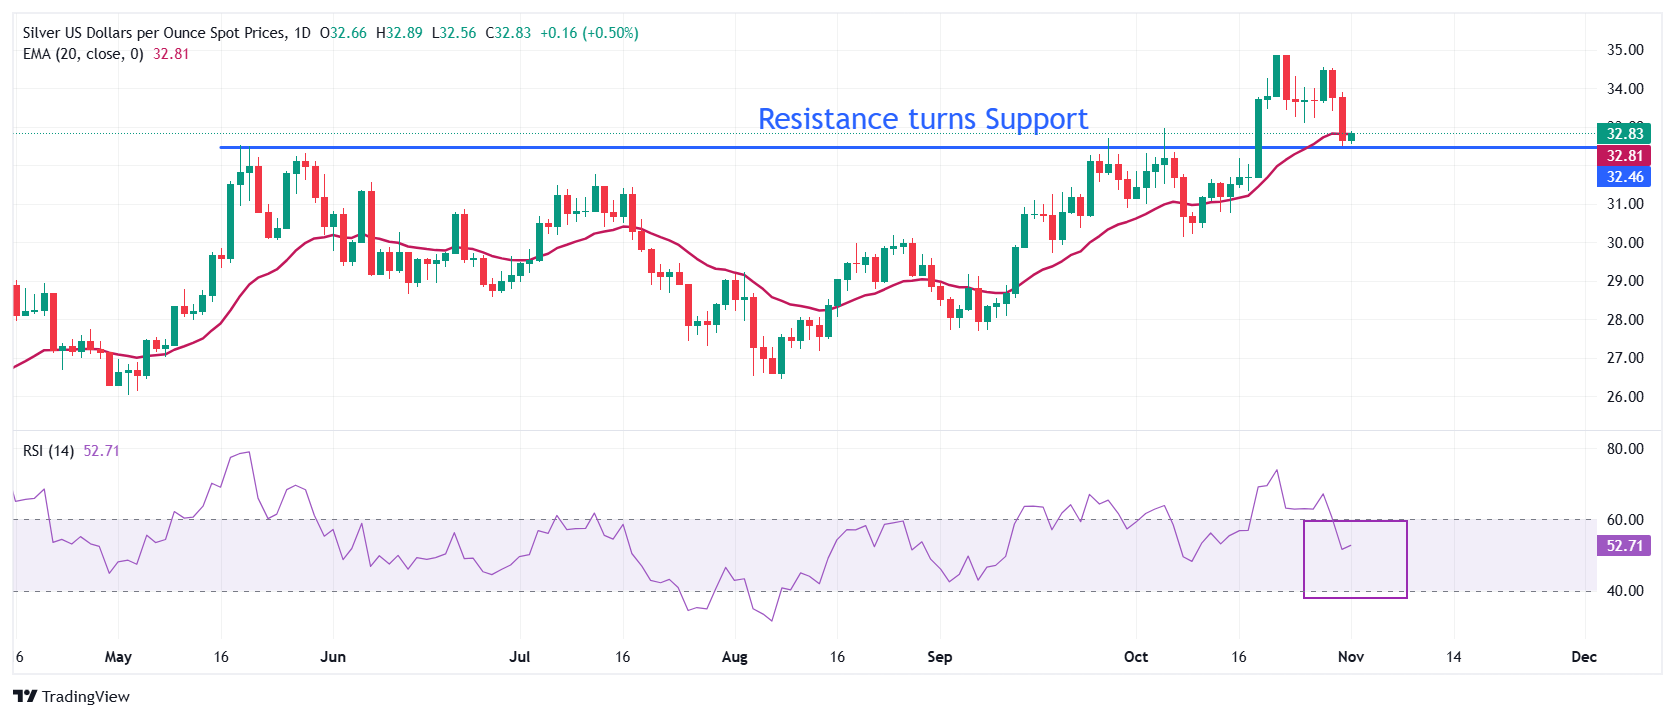
Silver price extends its correction to near the key horizontal support plotted from the May 20 high of $32.50 on a daily timeframe. The white metal finds a temporary cushion near the 20-day Exponential Moving Average (EMA), which trades at around $32.80.
The 14-day Relative Strength Index (RSI) falls inside the 40.00-60.00 range, suggesting that a bullish momentum is over for now, however, the bullish trend remains intact.
Silver daily chart
Silver FAQs
Silver is a precious metal highly traded among investors. It has been historically used as a store of value and a medium of exchange. Although less popular than Gold, traders may turn to Silver to diversify their investment portfolio, for its intrinsic value or as a potential hedge during high-inflation periods. Investors can buy physical Silver, in coins or in bars, or trade it through vehicles such as Exchange Traded Funds, which track its price on international markets.
Silver prices can move due to a wide range of factors. Geopolitical instability or fears of a deep recession can make Silver price escalate due to its safe-haven status, although to a lesser extent than Gold's. As a yieldless asset, Silver tends to rise with lower interest rates. Its moves also depend on how the US Dollar (USD) behaves as the asset is priced in dollars (XAG/USD). A strong Dollar tends to keep the price of Silver at bay, whereas a weaker Dollar is likely to propel prices up. Other factors such as investment demand, mining supply – Silver is much more abundant than Gold – and recycling rates can also affect prices.
Silver is widely used in industry, particularly in sectors such as electronics or solar energy, as it has one of the highest electric conductivity of all metals – more than Copper and Gold. A surge in demand can increase prices, while a decline tends to lower them. Dynamics in the US, Chinese and Indian economies can also contribute to price swings: for the US and particularly China, their big industrial sectors use Silver in various processes; in India, consumers’ demand for the precious metal for jewellery also plays a key role in setting prices.
Silver prices tend to follow Gold's moves. When Gold prices rise, Silver typically follows suit, as their status as safe-haven assets is similar. The Gold/Silver ratio, which shows the number of ounces of Silver needed to equal the value of one ounce of Gold, may help to determine the relative valuation between both metals. Some investors may consider a high ratio as an indicator that Silver is undervalued, or Gold is overvalued. On the contrary, a low ratio might suggest that Gold is undervalued relative to Silver.
Author

Sagar Dua
FXStreet
Sagar Dua is associated with the financial markets from his college days. Along with pursuing post-graduation in Commerce in 2014, he started his markets training with chart analysis.