Silver Price Forecast: XAG/USD drops to nearly two-month low, 100-day SMA breakdown in play


  • Silver remains under some selling pressure on Thursday and retests October's swing low. 
  • The technical setup favors bearish traders and supports prospects for additional losses.
  • Any attempted recovery could still be seen as a selling opportunity and remain capped.

Silver (XAG/USD) attracts some follow-through selling during the Asian session on Thursday and drops to its lowest level since September 19 in the last hour. Bearish traders now await a sustained break below the $30.00 psychological mark before positioning for an extension of the recent sharp retracement slide from a 12-year peak touched last month.

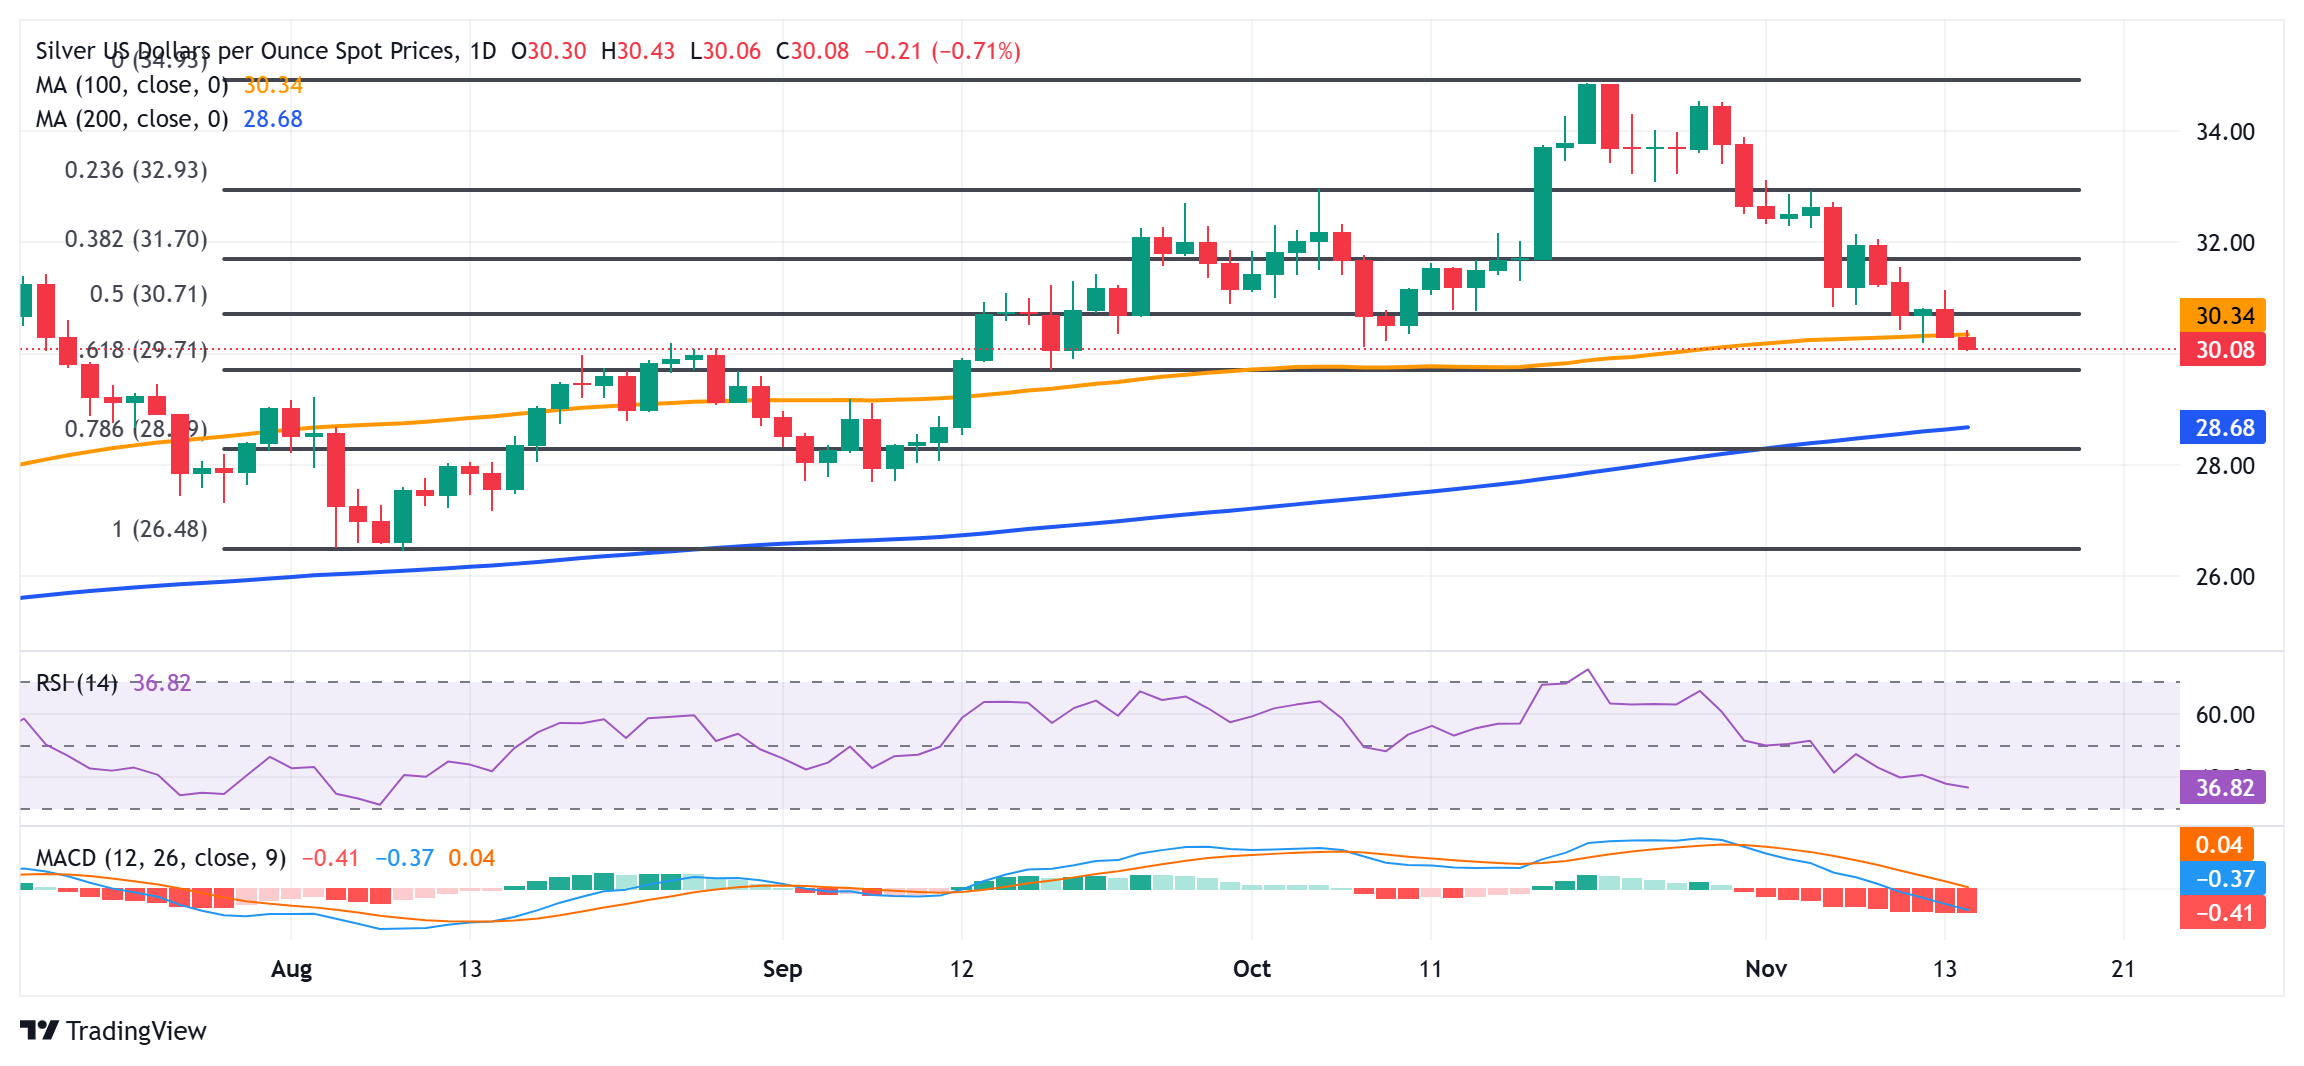
The overnight close below the 50% Fibonacci retracement level of the August-October rally and a subsequent break through the 100-day Simple Moving Average (SMA) for the first time since September could be seen as a fresh trigger for bearish traders. Moreover, oscillators on the daily chart have been gaining negative traction and are still away from being in the oversold zone. This, in turn, suggests that the path of least resistance for the XAG/USD remains to the downside and supports prospects for a further depreciating move. 

The white metal might then accelerate the fall towards the 61.8% Fibo. level, around the $29.65-$29.60 region. The downward trajectory could extend further towards the $29.20-$29.15 area before the XAG/USD eventually breaks below the $29.00 mark and tests a technically significant 200-day SMA, currently pegged near the $28.65 zone.

On the flip side, any meaningful recovery attempt might now confront a stiff barrier near the $30.60 region (50% Fibo. level). Some follow-through strength, however, could trigger a short-covering rally and allow the XAG/USD to reclaim the $31.00 mark, though the momentum is more likely to remain capped near the $31.20 support-turned-resistance. The latter should act as a key pivotal point, which if cleared decisively will suggest that the commodity has formed a near-term bottom and pave the way for additional gains.

Silver daily chart

fxsoriginal

Silver FAQs

Silver is a precious metal highly traded among investors. It has been historically used as a store of value and a medium of exchange. Although less popular than Gold, traders may turn to Silver to diversify their investment portfolio, for its intrinsic value or as a potential hedge during high-inflation periods. Investors can buy physical Silver, in coins or in bars, or trade it through vehicles such as Exchange Traded Funds, which track its price on international markets.

Silver prices can move due to a wide range of factors. Geopolitical instability or fears of a deep recession can make Silver price escalate due to its safe-haven status, although to a lesser extent than Gold's. As a yieldless asset, Silver tends to rise with lower interest rates. Its moves also depend on how the US Dollar (USD) behaves as the asset is priced in dollars (XAG/USD). A strong Dollar tends to keep the price of Silver at bay, whereas a weaker Dollar is likely to propel prices up. Other factors such as investment demand, mining supply – Silver is much more abundant than Gold – and recycling rates can also affect prices.

Silver is widely used in industry, particularly in sectors such as electronics or solar energy, as it has one of the highest electric conductivity of all metals – more than Copper and Gold. A surge in demand can increase prices, while a decline tends to lower them. Dynamics in the US, Chinese and Indian economies can also contribute to price swings: for the US and particularly China, their big industrial sectors use Silver in various processes; in India, consumers’ demand for the precious metal for jewellery also plays a key role in setting prices.

Silver prices tend to follow Gold's moves. When Gold prices rise, Silver typically follows suit, as their status as safe-haven assets is similar. The Gold/Silver ratio, which shows the number of ounces of Silver needed to equal the value of one ounce of Gold, may help to determine the relative valuation between both metals. Some investors may consider a high ratio as an indicator that Silver is undervalued, or Gold is overvalued. On the contrary, a low ratio might suggest that Gold is undervalued relative to Silver.


Share: Feed news

Information on these pages contains forward-looking statements that involve risks and uncertainties. Markets and instruments profiled on this page are for informational purposes only and should not in any way come across as a recommendation to buy or sell in these assets. You should do your own thorough research before making any investment decisions. FXStreet does not in any way guarantee that this information is free from mistakes, errors, or material misstatements. It also does not guarantee that this information is of a timely nature. Investing in Open Markets involves a great deal of risk, including the loss of all or a portion of your investment, as well as emotional distress. All risks, losses and costs associated with investing, including total loss of principal, are your responsibility. The views and opinions expressed in this article are those of the authors and do not necessarily reflect the official policy or position of FXStreet nor its advertisers. The author will not be held responsible for information that is found at the end of links posted on this page.

If not otherwise explicitly mentioned in the body of the article, at the time of writing, the author has no position in any stock mentioned in this article and no business relationship with any company mentioned. The author has not received compensation for writing this article, other than from FXStreet.

FXStreet and the author do not provide personalized recommendations. The author makes no representations as to the accuracy, completeness, or suitability of this information. FXStreet and the author will not be liable for any errors, omissions or any losses, injuries or damages arising from this information and its display or use. Errors and omissions excepted.

The author and FXStreet are not registered investment advisors and nothing in this article is intended to be investment advice.

XM
Account
7.2
Tools
9.2
Service
9.4
Trading
9.0
Trust
7.0
Experience
8.4
Read review
Moneta Markets
Account
7.4
Tools
6.6
Service
8.0
Trading
6.6
Trust
5.2
Experience
9.2
Read review
Trading Pro
Account
7.2
Tools
5.2
Service
6.6
Trading
8.0
Trust
5.0
Experience
7.0
Read review
Pepperstone
Account
8.2
Tools
8.2
Service
7.4
Trading
9.0
Trust
8.8
Experience
9.0
Read review
XM
Read review
Moneta Markets
Read review
Trading Pro
Read review
Pepperstone
Read review
Trading Pro
Read review
Pepperstone
Read review
XM
Read review
Moneta Markets
Read review
Trading Pro
Account
7.2
Tools
5.2
Service
6.6
Trading
8.0
Trust
5.0
Experience
7.0
Read review
Pepperstone
Account
8.2
Tools
8.2
Service
7.4
Trading
9.0
Trust
8.8
Experience
9.0
Read review
XM
Account
7.2
Tools
9.2
Service
9.4
Trading
9.0
Trust
7.0
Experience
8.4
Read review
Moneta Markets
Account
7.4
Tools
6.6
Service
8.0
Trading
6.6
Trust
5.2
Experience
9.2
Read review

Recommended content


Recommended content

Editors’ Picks

AUD/USD weighed down by China, tariffs

AUD/USD weighed down by China, tariffs

AUD/USD remained on the back foot, slipping back to the area of multi-year lows around 0.5950 on the back of mounting fears surrounding tariffs and their impact on the Chinese economy.

AUD/USD News
EUR/USD refocuses on 1.1000 amid tariffs jitters

EUR/USD refocuses on 1.1000 amid tariffs jitters

EUR/USD reversed two daily pullbacks in a row an d managed to advance to the boundaries of the 1.1000 barrier on the back of fresh weakness hurting the US Dollar and persistent tariff fears.

EUR/USD News
Gold erases gains, back to the $2,980 zone

Gold erases gains, back to the $2,980 zone

Gold prices now lose extra ground and slip back to the area of daily troughs near $2,980 mark per troy ounce following an unsuccesful attempt to maintain the trade above the critical $3,000 level earlier in the day.

Gold News
RBNZ set for another interest rate cut amid trade tariff uncertainty

RBNZ set for another interest rate cut amid trade tariff uncertainty

The Reserve Bank of New Zealand is on track to deliver a 25 basis point cut to the Official Cash Rate, bringing down the key policy rate from 3.75% to 3.50% following its April monetary policy meeting on Wednesday. 

Read more
The Fed is looking at a hefty price level

The Fed is looking at a hefty price level

We are still in thrall to tariffs, the faux-macro “data” driving markets. The WSJ editorial board advised other countries to take their tariffs to zero so that Trump’s “reciprocal” tariffs will have to be zero, too. Cute, but no cigar.

Read more
The Best brokers to trade EUR/USD

The Best brokers to trade EUR/USD

SPONSORED Discover the top brokers for trading EUR/USD in 2025. Our list features brokers with competitive spreads, fast execution, and powerful platforms. Whether you're a beginner or an expert, find the right partner to navigate the dynamic Forex market.

Read More

Forex MAJORS

Cryptocurrencies

Signatures

Best Brokers of 2025