Silver Price Forecast: XAG/USD corrects further to near $31.60 as traders brace for US inflation
- Silver price drops to near $31.60 with US core PCE inflation taking center stage.
- The US core PCE inflation is expected to accelerate to 2.7% year-on-year in August.
- Investors expect the Fed to reduce interest rates further by 75 bps in the remainder of the year.

Silver price (XAG/USD) extends its correction to near $31.60 in Friday’s European session after facing selling pressure from fresh highs of $32.70 on Thursday. The white metal comes under pressure as investors turn cautious ahead of the United States (US) Personal Consumption Expenditure Price Index (PCE) for August, which will be published at 12:30 GMT.
Economists estimate the core PCE price index, a Federal Reserve’s (Fed) preferred inflation measure, to have grown by 2.7%, faster than 2.6% in July, with monthly figures rising steadily by 0.2%. Investors keenly await the US inflation data as it will shape market speculation for the Fed’s likely policy action in the final quarter of this year.
According to the CME FedWatch tool, the central bank is expected to reduce its key borrowing rates further by 75 bps in the remaining two meetings this year, suggesting that there will be one 50 bps and one 25 bps rate cut. 30-day Federal fund futures pricing data shows that traders are equally split over a 25 or 50 bps interest rate cut in November.
Meanwhile, the US Dollar Index (DXY), which tracks the Greenback’s value against six major currencies, surrenders its early gains and hovers above 100.50. 10-year US Treasury yields edge lower to 3.79%.
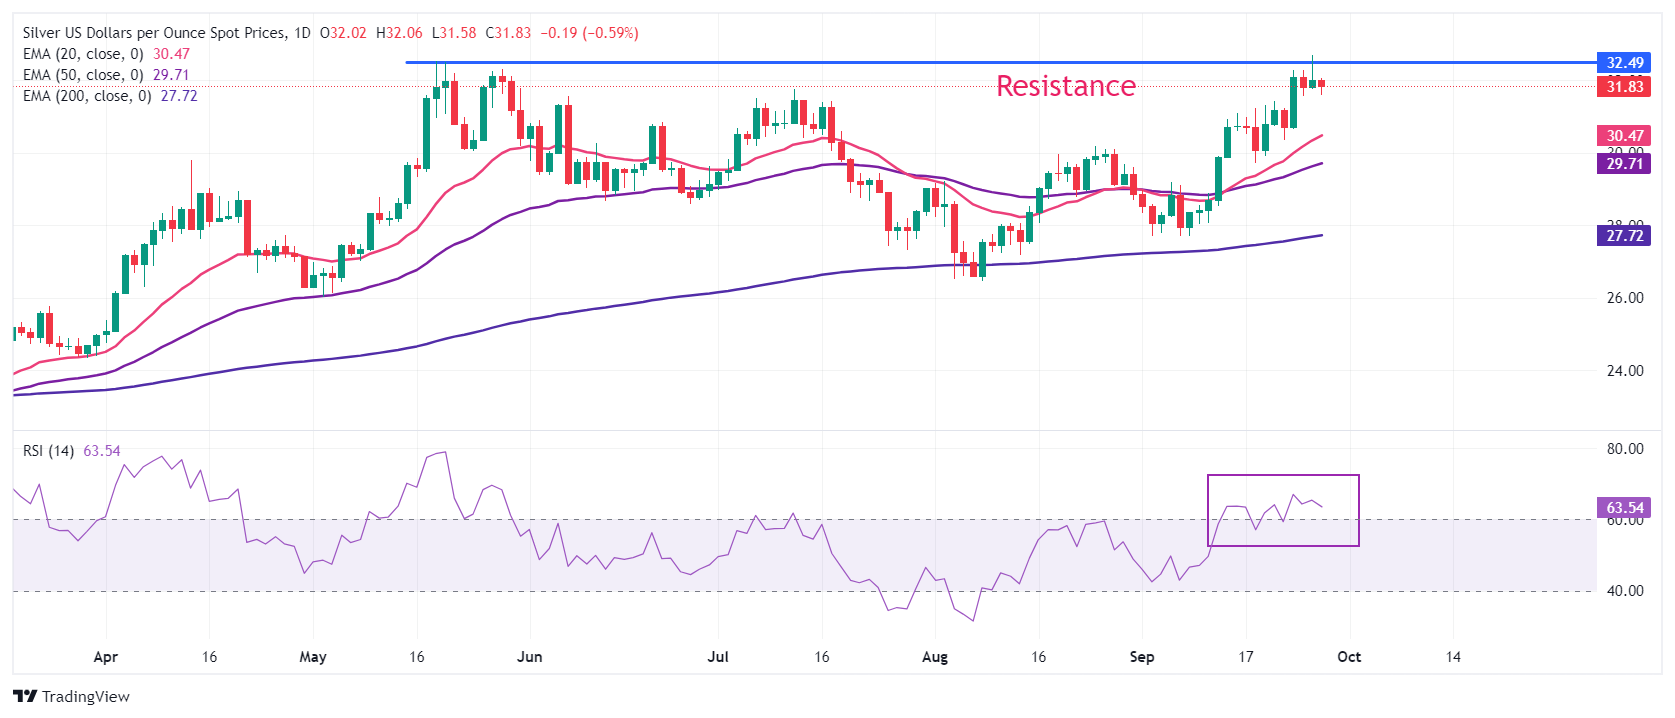
Silver technical analysis
Silver price falls slightly after posting a fresh decade high near $32.70. The white metal is under pressure ahead of key inflation data. However, its near-term outlook is bullish as all short-to-long-term Exponential Moving Averages (EMAs) are sloping higher.
The 14-day Relative Strength Index (RSI) oscillates in the bullish range of 60.00-80.00, suggesting a strong bullish momentum.
(This story was corrected on September 27 at 11:49 GMT to say that US core PCE inflation is expected to accelerate to 2.7%, not accelerated to 2.7%, nor has it grown by 2.37%.)
Silver daily chart
Silver FAQs
Silver is a precious metal highly traded among investors. It has been historically used as a store of value and a medium of exchange. Although less popular than Gold, traders may turn to Silver to diversify their investment portfolio, for its intrinsic value or as a potential hedge during high-inflation periods. Investors can buy physical Silver, in coins or in bars, or trade it through vehicles such as Exchange Traded Funds, which track its price on international markets.
Silver prices can move due to a wide range of factors. Geopolitical instability or fears of a deep recession can make Silver price escalate due to its safe-haven status, although to a lesser extent than Gold's. As a yieldless asset, Silver tends to rise with lower interest rates. Its moves also depend on how the US Dollar (USD) behaves as the asset is priced in dollars (XAG/USD). A strong Dollar tends to keep the price of Silver at bay, whereas a weaker Dollar is likely to propel prices up. Other factors such as investment demand, mining supply – Silver is much more abundant than Gold – and recycling rates can also affect prices.
Silver is widely used in industry, particularly in sectors such as electronics or solar energy, as it has one of the highest electric conductivity of all metals – more than Copper and Gold. A surge in demand can increase prices, while a decline tends to lower them. Dynamics in the US, Chinese and Indian economies can also contribute to price swings: for the US and particularly China, their big industrial sectors use Silver in various processes; in India, consumers’ demand for the precious metal for jewellery also plays a key role in setting prices.
Silver prices tend to follow Gold's moves. When Gold prices rise, Silver typically follows suit, as their status as safe-haven assets is similar. The Gold/Silver ratio, which shows the number of ounces of Silver needed to equal the value of one ounce of Gold, may help to determine the relative valuation between both metals. Some investors may consider a high ratio as an indicator that Silver is undervalued, or Gold is overvalued. On the contrary, a low ratio might suggest that Gold is undervalued relative to Silver.
Author

Sagar Dua
FXStreet
Sagar Dua is associated with the financial markets from his college days. Along with pursuing post-graduation in Commerce in 2014, he started his markets training with chart analysis.


