Silver Price Forecast: XAG/USD consolidates around $29 as investors await US PCE inflation data
- Silves price trades in a limited range, with investors focusing on the US PCE inflation data for November.
- The Fed signaled fewer interest rate cuts for the next year in its policy meeting on Wednesday.
- The US Dollar and bond yields have rallied on Fed’s hawkish guidance.

Silver price (XAG/USD) trades in a tight range around $29.00 in Friday’s European trading session. The white metal consolidates as investors await the United States (US) core Personal Consumption Expenditure Price Index (PCE) data for November, which will be published at 13:30 GMT.
Economists expect the US annual core PCE inflation data to have accelerated to 2.9% from 2.8% in October. On month, the underlying inflation data is estimated to have grown steadily by 0.2%. Signs of mild slowdown in price pressures are unlikely to impact market expectations that the Federal Reserve (Fed) will pause the policy-easing spell in the policy meeting in January 2025. However, a sharp deceleration could weigh on them. On the contrary, a mild or sharp acceleration in price pressures would strengthen them.
In the policy meeting on Wednesday, the Fed reduced its key borrowing rates by 25 basis points (bps) to 4.25%-4.50% but signaled fewer interest rate cuts for 2025. The Fed dot plot showed that officials collectively see Federal Fund rates heading to 3.9% by 2025 against 3.4% projected in September.
Ahead of the US PCE inflation data, the US Dollar Index (DXY), which tracks the Greenback’s value against six major currencies, edges lower after posting a fresh two-year high at 108.50. 10-year US Treasury yields tick lower to 4.56% from a fresh six-month high of 4.60%. Higher yields on interest-bearing assets increase the opportunity cost of holding an investment in non-yielding assets, such as Silver.
Silver technical analysis
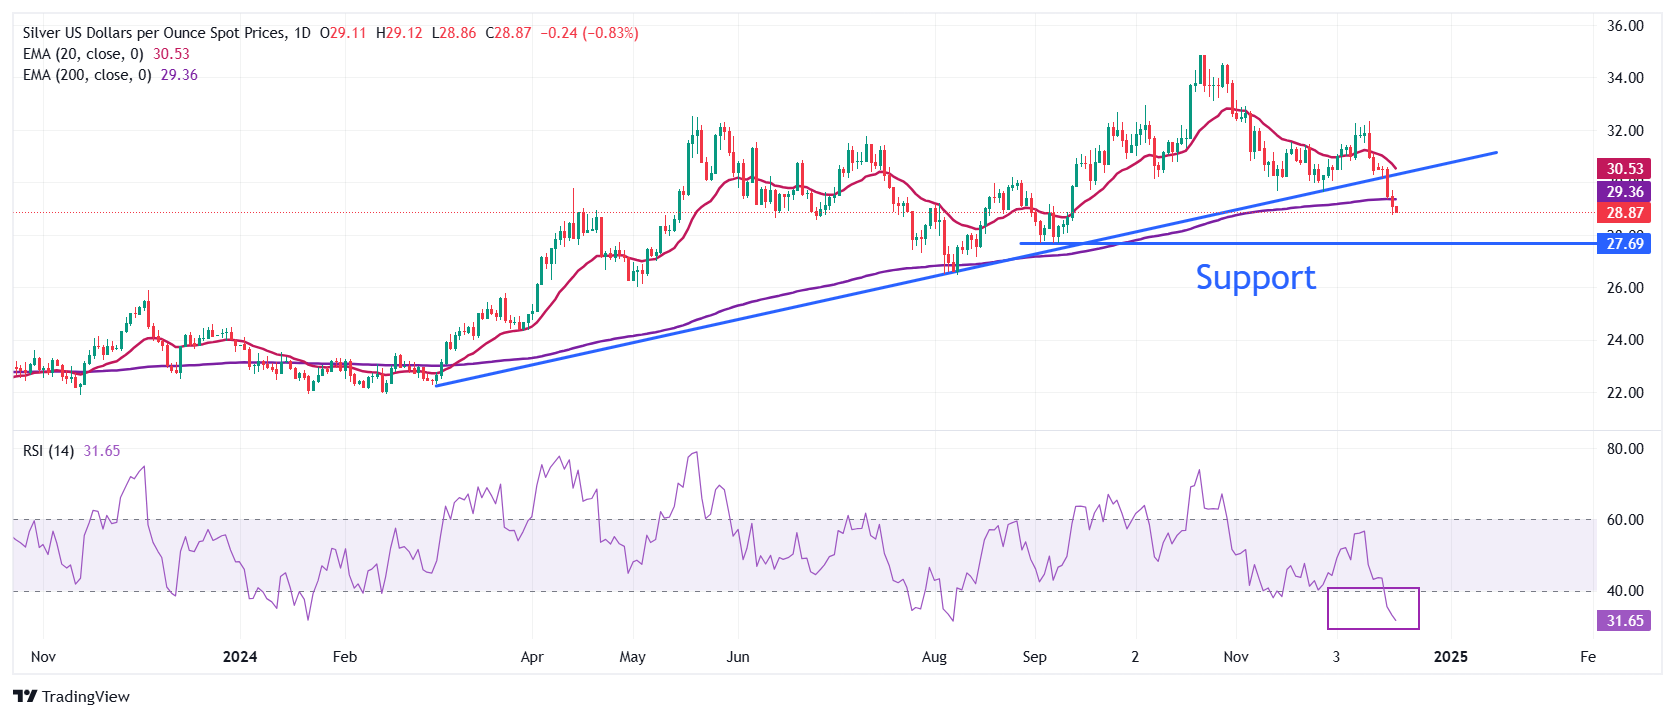
Silver price slides below the 200-day Exponential Moving Average (EMA), which trades around $29.35. The white metal weakens after a breakdown of the upward-sloping trendline around $30.20, which is plotted from the February 29 low of $22.30.
The 14-day Relative Strength Index (RSI) drops inside the bearish range of 20.00-40.00 range, guiding a downside momentum ahead.
Looking down, the September low of $27.75 would as key support for the Silver price. On the upside, the 50-day EMA around $30.90 would be the barrier.
Silver daily chart
Silver FAQs
Silver is a precious metal highly traded among investors. It has been historically used as a store of value and a medium of exchange. Although less popular than Gold, traders may turn to Silver to diversify their investment portfolio, for its intrinsic value or as a potential hedge during high-inflation periods. Investors can buy physical Silver, in coins or in bars, or trade it through vehicles such as Exchange Traded Funds, which track its price on international markets.
Silver prices can move due to a wide range of factors. Geopolitical instability or fears of a deep recession can make Silver price escalate due to its safe-haven status, although to a lesser extent than Gold's. As a yieldless asset, Silver tends to rise with lower interest rates. Its moves also depend on how the US Dollar (USD) behaves as the asset is priced in dollars (XAG/USD). A strong Dollar tends to keep the price of Silver at bay, whereas a weaker Dollar is likely to propel prices up. Other factors such as investment demand, mining supply – Silver is much more abundant than Gold – and recycling rates can also affect prices.
Silver is widely used in industry, particularly in sectors such as electronics or solar energy, as it has one of the highest electric conductivity of all metals – more than Copper and Gold. A surge in demand can increase prices, while a decline tends to lower them. Dynamics in the US, Chinese and Indian economies can also contribute to price swings: for the US and particularly China, their big industrial sectors use Silver in various processes; in India, consumers’ demand for the precious metal for jewellery also plays a key role in setting prices.
Silver prices tend to follow Gold's moves. When Gold prices rise, Silver typically follows suit, as their status as safe-haven assets is similar. The Gold/Silver ratio, which shows the number of ounces of Silver needed to equal the value of one ounce of Gold, may help to determine the relative valuation between both metals. Some investors may consider a high ratio as an indicator that Silver is undervalued, or Gold is overvalued. On the contrary, a low ratio might suggest that Gold is undervalued relative to Silver.
Author

Sagar Dua
FXStreet
Sagar Dua is associated with the financial markets from his college days. Along with pursuing post-graduation in Commerce in 2014, he started his markets training with chart analysis.


