Silver Price Forecast: XAG/USD bulls retain control above $32.00, over one-month high
- Silver attracts some buyers on Thursday and remains closer to over a one-month top.
- The technical setup favors bullish traders and supports prospects for additional gains.
- Any corrective pullback could be seen as a buying opportunity and remain limited.

Silver (XAG/USD) trades with a positive bias above the $32.00 mark during the Asian session on Thursday and remains close to over a one-month high touched earlier this week. Moreover, the technical setup suggests that the path of least resistance for the white metal remains to the upside.
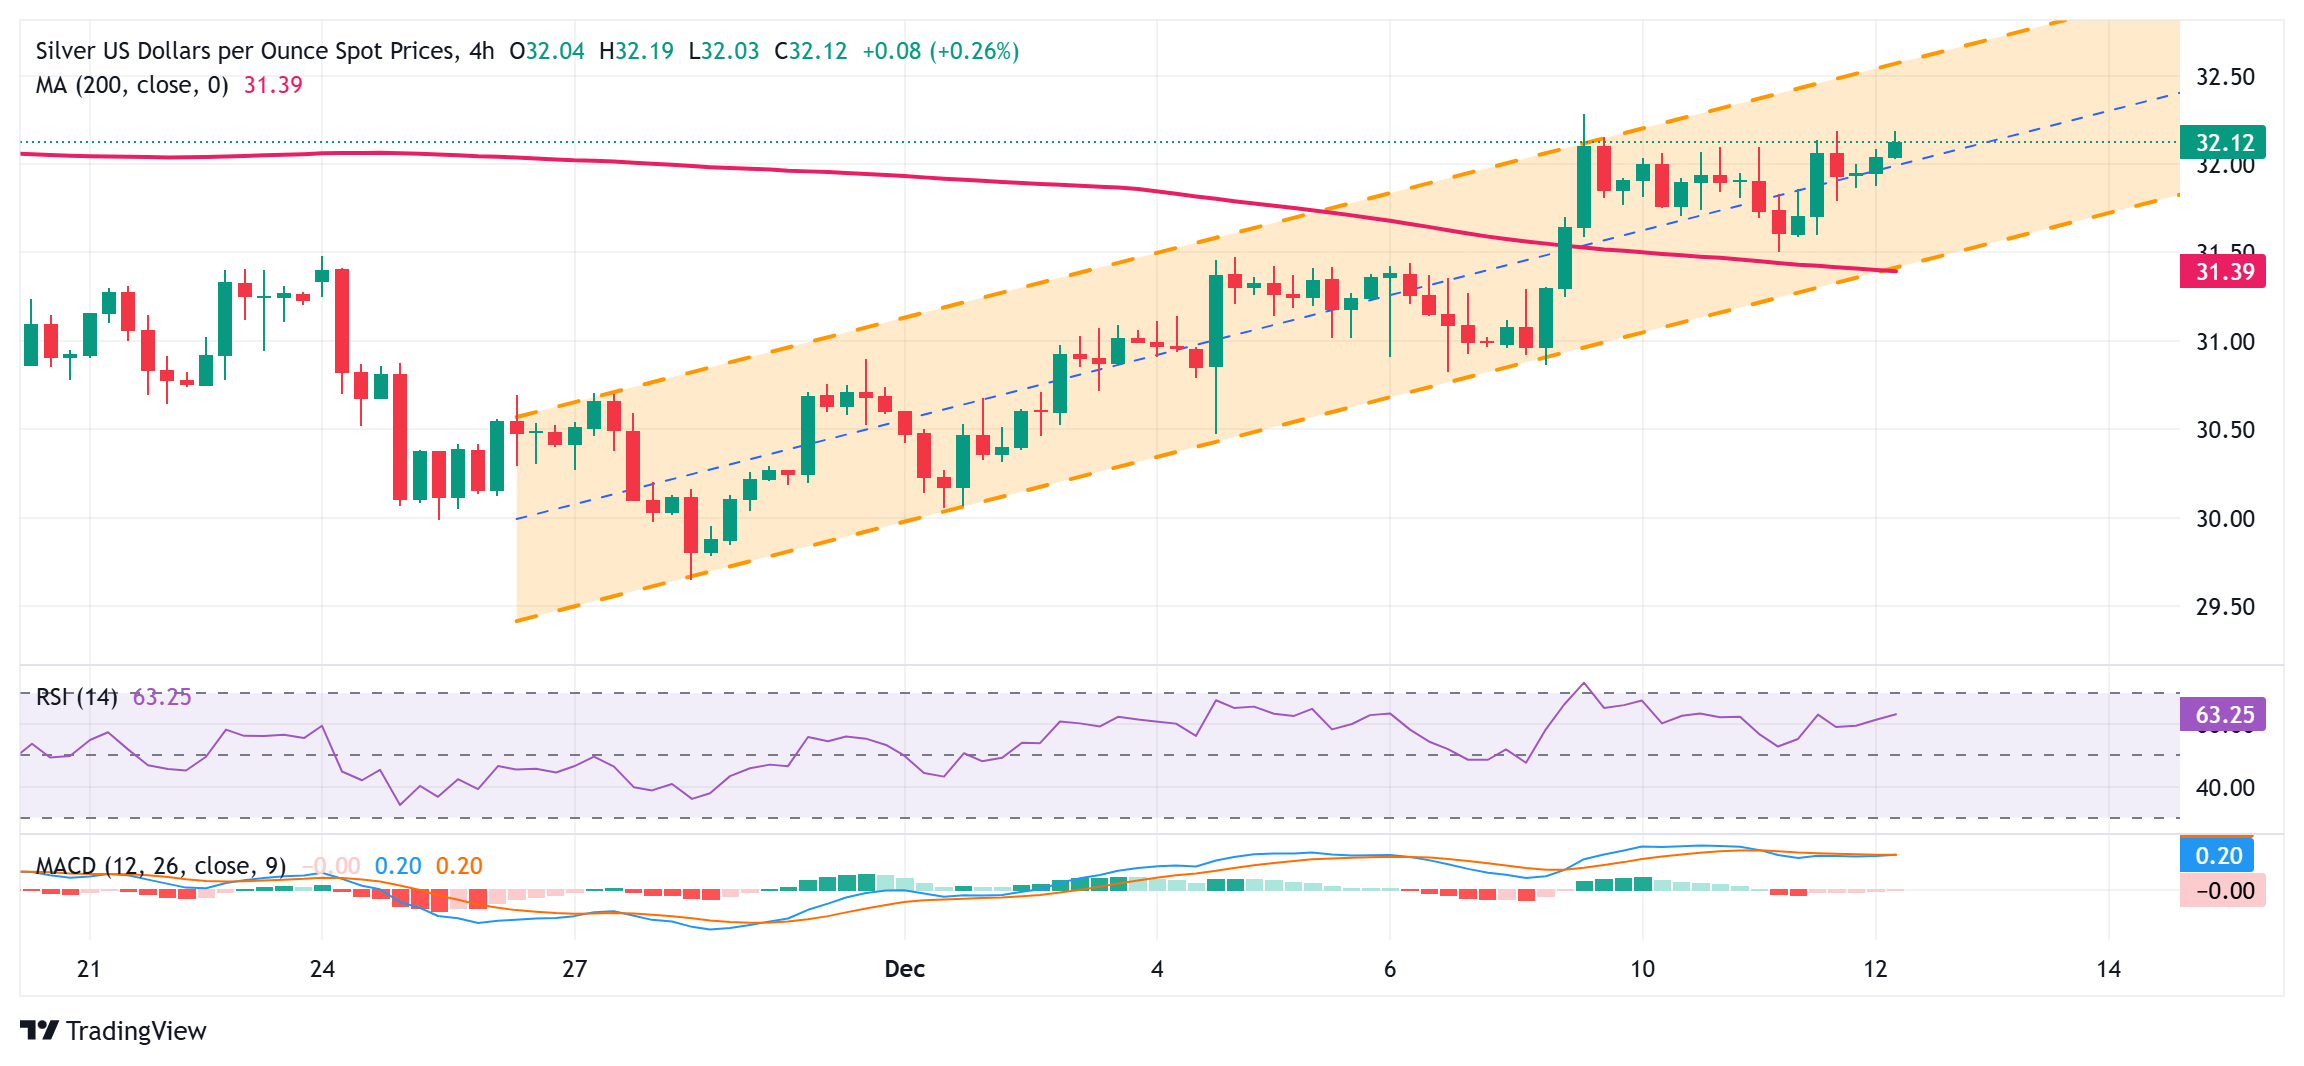
This week's sustained move beyond the 200-period Simple Moving Average (SMA) on the 4-hour chart was seen as a key trigger for bullish traders. Moreover, the recent move-up witnessed over the past two weeks or so has been along an upward-sloping channel. Apart from this, positive technical indicators on daily/hourly charts validate the near-term positive outlook for the XAU/USD and support prospects for additional gains.
Hence, a subsequent move up towards retesting the monthly swing high, around the $32.55-$32.60 area, which now coincides with the top boundary of the aforementioned channel, looks like a distinct possibility. Some follow-through buying will confirm a fresh breakout and lift the XAG/USD to the next relevant hurdle near the $32.80-$32.85 region en route to the $33.00 round figure mark and the $33.20-$33.25 horizontal resistance.
On the flip side, weakness below the $32.00-$31.90 area now seems to find some support near the $31.60 horizontal zone ahead of the $31.45-$31.40 confluence. The latter comprises the 200-period SMA on the 4-hour chart and the ascending channel support, which if broken decisively might prompt aggressive selling and shift the bias in favor of bearish traders. The XAG/USD might then drop to sub-$31.00 levels en route to mid-$30.00s.
Silver 4-hour chart
Silver FAQs
Silver is a precious metal highly traded among investors. It has been historically used as a store of value and a medium of exchange. Although less popular than Gold, traders may turn to Silver to diversify their investment portfolio, for its intrinsic value or as a potential hedge during high-inflation periods. Investors can buy physical Silver, in coins or in bars, or trade it through vehicles such as Exchange Traded Funds, which track its price on international markets.
Silver prices can move due to a wide range of factors. Geopolitical instability or fears of a deep recession can make Silver price escalate due to its safe-haven status, although to a lesser extent than Gold's. As a yieldless asset, Silver tends to rise with lower interest rates. Its moves also depend on how the US Dollar (USD) behaves as the asset is priced in dollars (XAG/USD). A strong Dollar tends to keep the price of Silver at bay, whereas a weaker Dollar is likely to propel prices up. Other factors such as investment demand, mining supply – Silver is much more abundant than Gold – and recycling rates can also affect prices.
Silver is widely used in industry, particularly in sectors such as electronics or solar energy, as it has one of the highest electric conductivity of all metals – more than Copper and Gold. A surge in demand can increase prices, while a decline tends to lower them. Dynamics in the US, Chinese and Indian economies can also contribute to price swings: for the US and particularly China, their big industrial sectors use Silver in various processes; in India, consumers’ demand for the precious metal for jewellery also plays a key role in setting prices.
Silver prices tend to follow Gold's moves. When Gold prices rise, Silver typically follows suit, as their status as safe-haven assets is similar. The Gold/Silver ratio, which shows the number of ounces of Silver needed to equal the value of one ounce of Gold, may help to determine the relative valuation between both metals. Some investors may consider a high ratio as an indicator that Silver is undervalued, or Gold is overvalued. On the contrary, a low ratio might suggest that Gold is undervalued relative to Silver.
Author

Haresh Menghani
FXStreet
Haresh Menghani is a detail-oriented professional with 10+ years of extensive experience in analysing the global financial markets.


