Silver Price Forecast: XAG/USD bears have the upper hand near three-week low, $30.00 holds the key
- Silver attracts some sellers for the third successive day on Wednesday.
- The technical setup supports prospects for a further depreciating move.
- Any attempted recovery is likely to remain capped near the $31.00 mark.

Silver (XAG/USD) struggles to capitalize on the overnight bounce from the vicinity of the $30.00 psychological mark, or a three-week low and trades with a negative bias for the third successive day on Wednesday. The white metal is currently placed just above the mid-$30.00s and seems vulnerable to prolonging its retracement slide from the highest level since December 2012 touched last week.
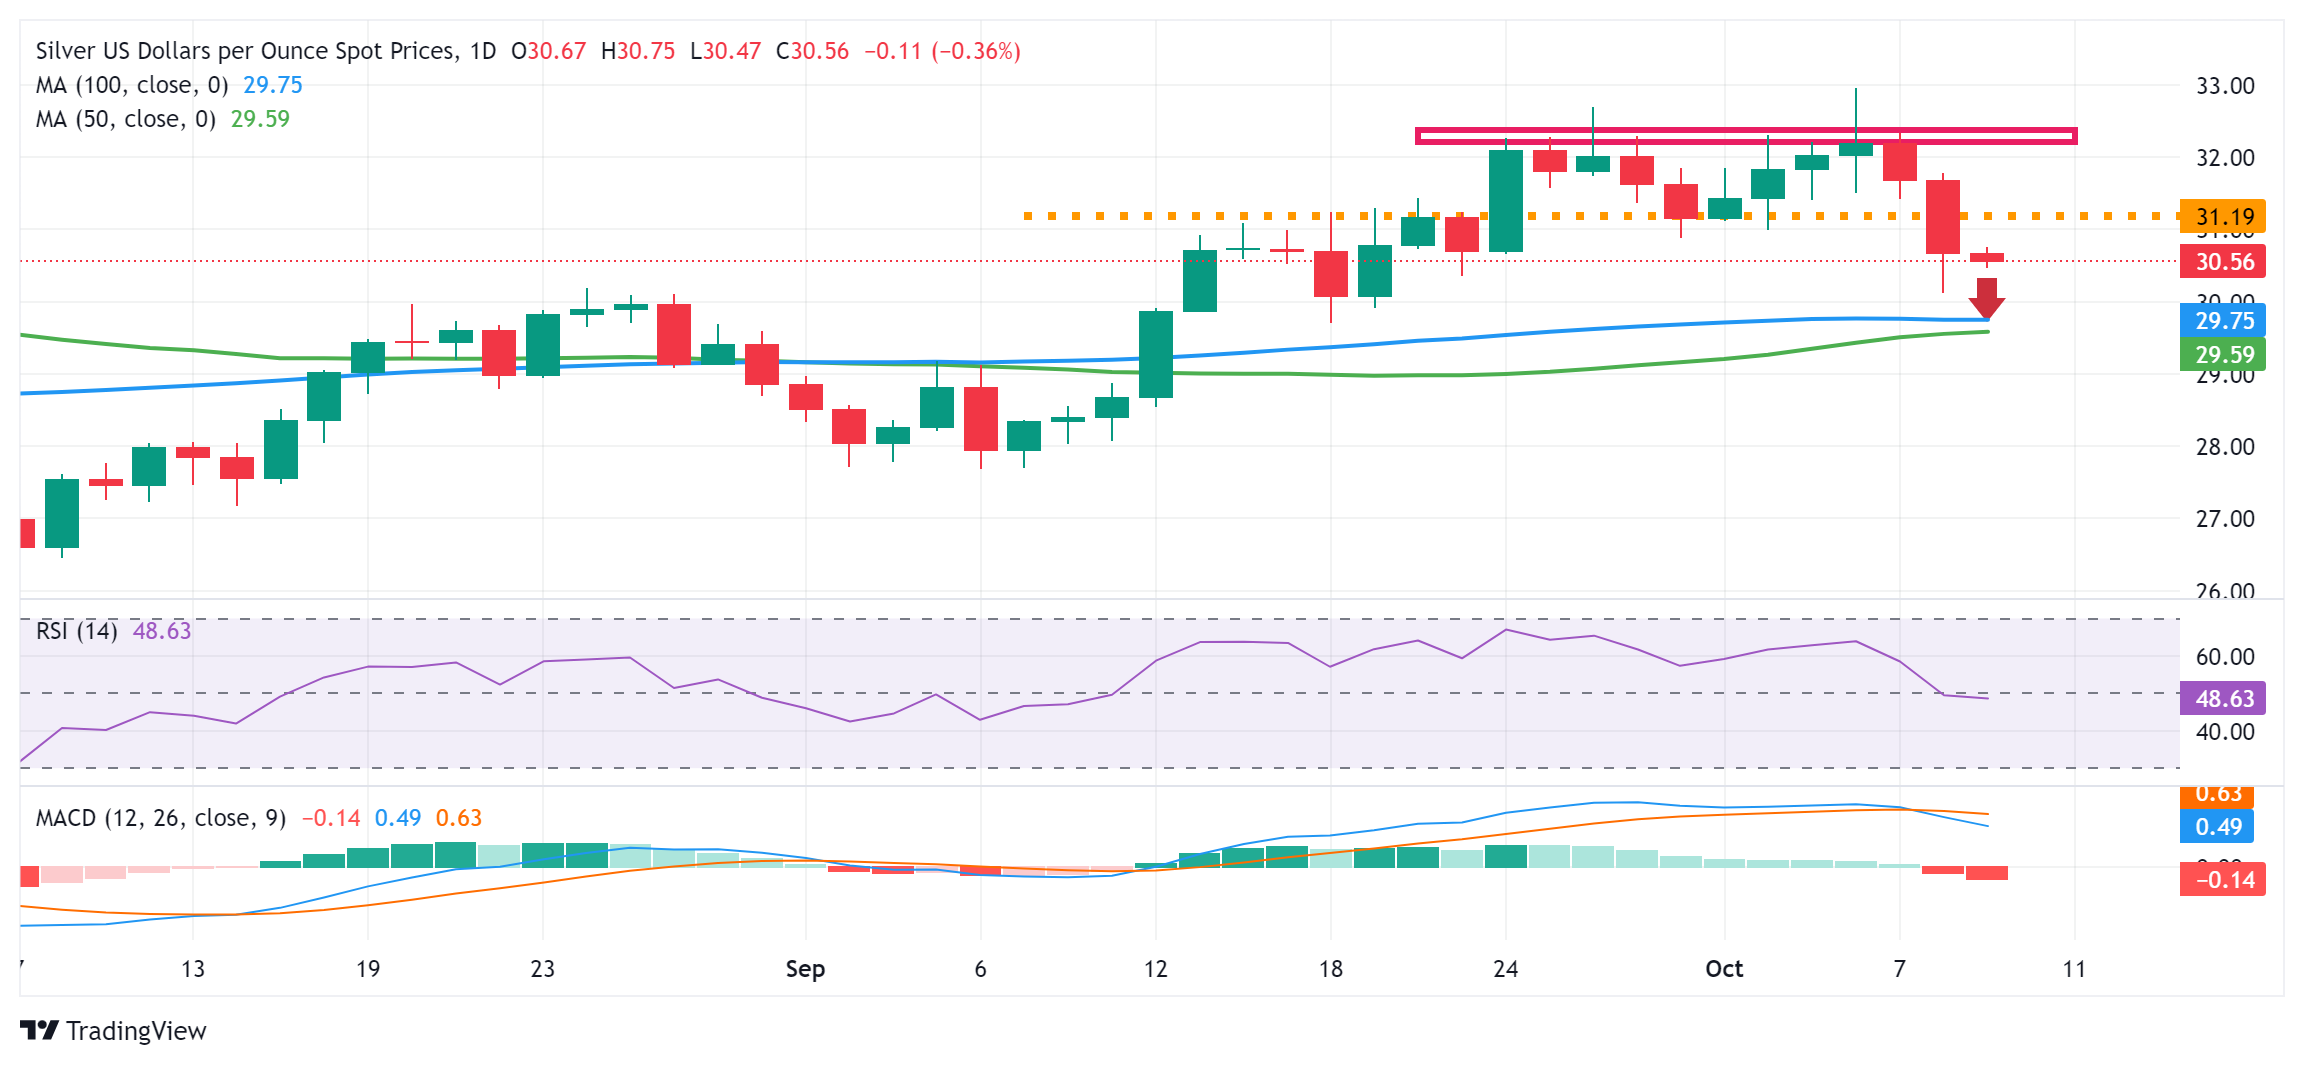
From a technical perspective, the recent repeated failures to find acceptance above the $32.00 mark constitute the formation of a bearish multiple-tops pattern on the daily chart. Moreover, oscillators on the daily chart have started gaining negative traction and validate the near-term bearish outlook for the XAG/USD. Hence, a subsequent slide below the $30.00 mark, towards testing the next relevant support near the $29.75-$29.60 confluence, looks like a distinct possibility.
The latter comprises the 100-day Simple Moving Average (SMA) and the 50-day SMA, which if broken decisively should pave the way for a further near-term depreciating move. The XAG/USD might then accelerate the fall towards the $29.00 mark and eventually drop to the $28.60-$28.50 support zone.
On the flip side, any attempted recovery might now confront immediate resistance and remain capped near the $31.00 mark. That said, a sustained move beyond could trigger a short-covering move and lift the XAG/USD to the $31.55 hurdle en route to the $31.75-$31.80 region and the $32.00 mark. This is followed by the $32.25 supply zone, above which the white metal could aim to challenge the multi-year peak and make a fresh attempt to conquer the $33.00 round figure.
Silver daily chart
Silver FAQs
Silver is a precious metal highly traded among investors. It has been historically used as a store of value and a medium of exchange. Although less popular than Gold, traders may turn to Silver to diversify their investment portfolio, for its intrinsic value or as a potential hedge during high-inflation periods. Investors can buy physical Silver, in coins or in bars, or trade it through vehicles such as Exchange Traded Funds, which track its price on international markets.
Silver prices can move due to a wide range of factors. Geopolitical instability or fears of a deep recession can make Silver price escalate due to its safe-haven status, although to a lesser extent than Gold's. As a yieldless asset, Silver tends to rise with lower interest rates. Its moves also depend on how the US Dollar (USD) behaves as the asset is priced in dollars (XAG/USD). A strong Dollar tends to keep the price of Silver at bay, whereas a weaker Dollar is likely to propel prices up. Other factors such as investment demand, mining supply – Silver is much more abundant than Gold – and recycling rates can also affect prices.
Silver is widely used in industry, particularly in sectors such as electronics or solar energy, as it has one of the highest electric conductivity of all metals – more than Copper and Gold. A surge in demand can increase prices, while a decline tends to lower them. Dynamics in the US, Chinese and Indian economies can also contribute to price swings: for the US and particularly China, their big industrial sectors use Silver in various processes; in India, consumers’ demand for the precious metal for jewellery also plays a key role in setting prices.
Silver prices tend to follow Gold's moves. When Gold prices rise, Silver typically follows suit, as their status as safe-haven assets is similar. The Gold/Silver ratio, which shows the number of ounces of Silver needed to equal the value of one ounce of Gold, may help to determine the relative valuation between both metals. Some investors may consider a high ratio as an indicator that Silver is undervalued, or Gold is overvalued. On the contrary, a low ratio might suggest that Gold is undervalued relative to Silver.
Author

Haresh Menghani
FXStreet
Haresh Menghani is a detail-oriented professional with 10+ years of extensive experience in analysing the global financial markets.


