Silver Price Analysis: XAG/USD seesaws near $24.00 inside monthly rising wedge


  • Silver grinds higher around one-month high, stays inside bearish chart pattern.
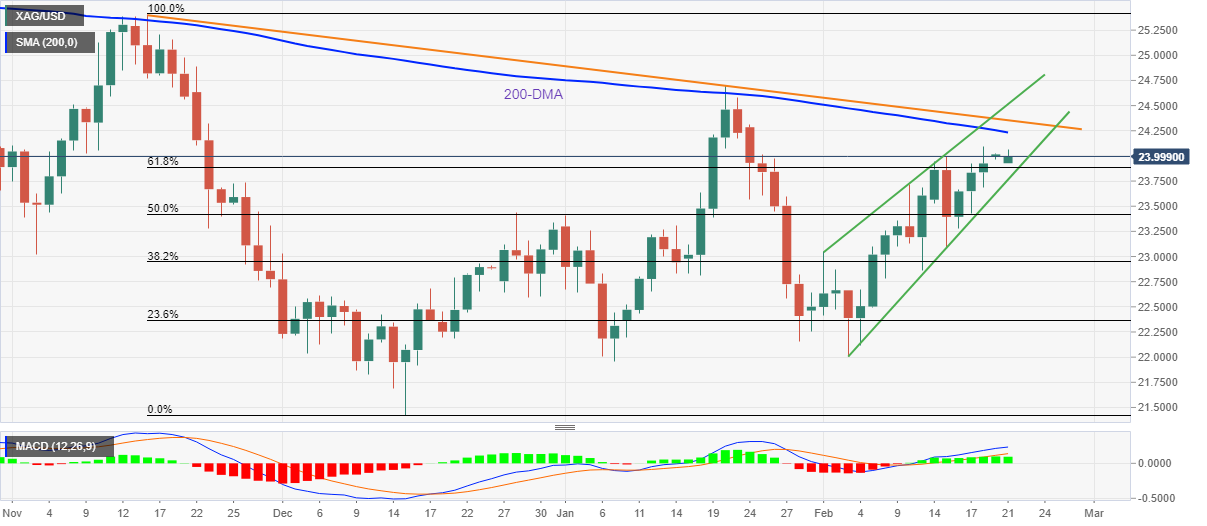
  • 200-DMA, 14-week-old resistance line challenge immediate upside, bullish MACD favor buyers.
  • Bears need validation from $23.70 while 50% Fibonacci retracement acts as another strong support.

After rising for three consecutive weeks, silver (XAG/USD) prices remain on the front foot around $24.00 during Monday’s Asian session.

In doing so, the bright metal pokes the highest levels last seen on January 24 while taking rounds to 61.8% Fibonacci retracement of November-December 2021 downside.

It should be noted, however, that the bullish MACD signals keep silver buyers hopeful to refresh monthly top.

That said, the 200-DMA and a descending trend line from late November, respectively around $24.25 and $24.35, become tough nuts to crack for the XAG/USD bulls.

Following that, the upper line of a three-week-old rising wedge bearish chart pattern and January’s peak, near $24.50 and $24.70 in that order, will challenge the commodity buyers.

Alternatively, a clear downside break of the 61.8% Fibo. level near $23.90 will attack the wedge’s lower line, near $23.70 at the latest.

Also acting as the key support is the $23.40 level comprising highs marked during late December and early January, as well as 50% Fibonacci retracement.

Should the silver bears manage to keep reins past $23.40, the 2022 bottom surrounding $21.95 will be in focus.

Silver: Daily chart

Trend: Pullback expected

Additional important levels

Overview
Today last price 24
Today Daily Change 0.08
Today Daily Change % 0.33%
Today daily open 23.92
 
Trends
Daily SMA20 23.2
Daily SMA50 23.02
Daily SMA100 23.29
Daily SMA200 24.27
 
Levels
Previous Daily High 24.09
Previous Daily Low 23.68
Previous Weekly High 24.09
Previous Weekly Low 23.08
Previous Monthly High 24.7
Previous Monthly Low 21.96
Daily Fibonacci 38.2% 23.93
Daily Fibonacci 61.8% 23.84
Daily Pivot Point S1 23.71
Daily Pivot Point S2 23.5
Daily Pivot Point S3 23.31
Daily Pivot Point R1 24.11
Daily Pivot Point R2 24.3
Daily Pivot Point R3 24.52


Share: Feed news

Information on these pages contains forward-looking statements that involve risks and uncertainties. Markets and instruments profiled on this page are for informational purposes only and should not in any way come across as a recommendation to buy or sell in these assets. You should do your own thorough research before making any investment decisions. FXStreet does not in any way guarantee that this information is free from mistakes, errors, or material misstatements. It also does not guarantee that this information is of a timely nature. Investing in Open Markets involves a great deal of risk, including the loss of all or a portion of your investment, as well as emotional distress. All risks, losses and costs associated with investing, including total loss of principal, are your responsibility. The views and opinions expressed in this article are those of the authors and do not necessarily reflect the official policy or position of FXStreet nor its advertisers. The author will not be held responsible for information that is found at the end of links posted on this page.

If not otherwise explicitly mentioned in the body of the article, at the time of writing, the author has no position in any stock mentioned in this article and no business relationship with any company mentioned. The author has not received compensation for writing this article, other than from FXStreet.

FXStreet and the author do not provide personalized recommendations. The author makes no representations as to the accuracy, completeness, or suitability of this information. FXStreet and the author will not be liable for any errors, omissions or any losses, injuries or damages arising from this information and its display or use. Errors and omissions excepted.

The author and FXStreet are not registered investment advisors and nothing in this article is intended to be investment advice.

Recommended content


Recommended content

Editors’ Picks

USD/JPY jumps above 156.00 on BoJ's steady policy

USD/JPY jumps above 156.00 on BoJ's steady policy

USD/JPY has come under intense buying pressure, surging past 156.00 after the Bank of Japan kept the key rate unchanged but tweaked its policy statement. The BoJ maintained its fiscal year 2024 and 2025 inflation forecast, disappointing the Japanese Yen buyers. 

USD/JPY News

AUD/USD consolidates gains above 0.6500 after Australian PPI data

AUD/USD consolidates gains above 0.6500 after Australian PPI data

AUD/USD is consolidating gains above 0.6500 in Asian trading on Friday. The pair capitalizes on an annual increase in Australian PPI data. Meanwhile, a softer US Dollar and improving market mood also underpin the Aussie ahead of the US PCE inflation data. 

AUD/USD News

Gold price keeps its range around $2,330, awaits US PCE data

Gold price keeps its range around $2,330, awaits US PCE data

Gold price is consolidating Thursday's rebound early Friday. Gold price jumped after US GDP figures for the first quarter of 2024 missed estimates, increasing speculation that the Fed could lower borrowing costs. Focus shifts to US PCE inflation on Friday. 

Gold News

Stripe looks to bring back crypto payments as stablecoin market cap hits all-time high

Stripe looks to bring back crypto payments as stablecoin market cap hits all-time high

Stripe announced on Thursday that it would add support for USDC stablecoin, as the stablecoin market exploded in March, according to reports by Cryptocompare.

Read more

US economy: Slower growth with stronger inflation

US economy: Slower growth with stronger inflation

The US Dollar strengthened, and stocks fell after statistical data from the US. The focus was on the preliminary estimate of GDP for the first quarter. Annualised quarterly growth came in at just 1.6%, down from the 2.5% and 3.4% previously forecast.

Read more

Forex MAJORS

Cryptocurrencies

Signatures