Silver price Analysis: XAG/USD retreats from 13-day-old resistance line below $21.00


  • Silver price struggles to extend recovery from four-month low, pares intraday gains during a three-day uptrend.
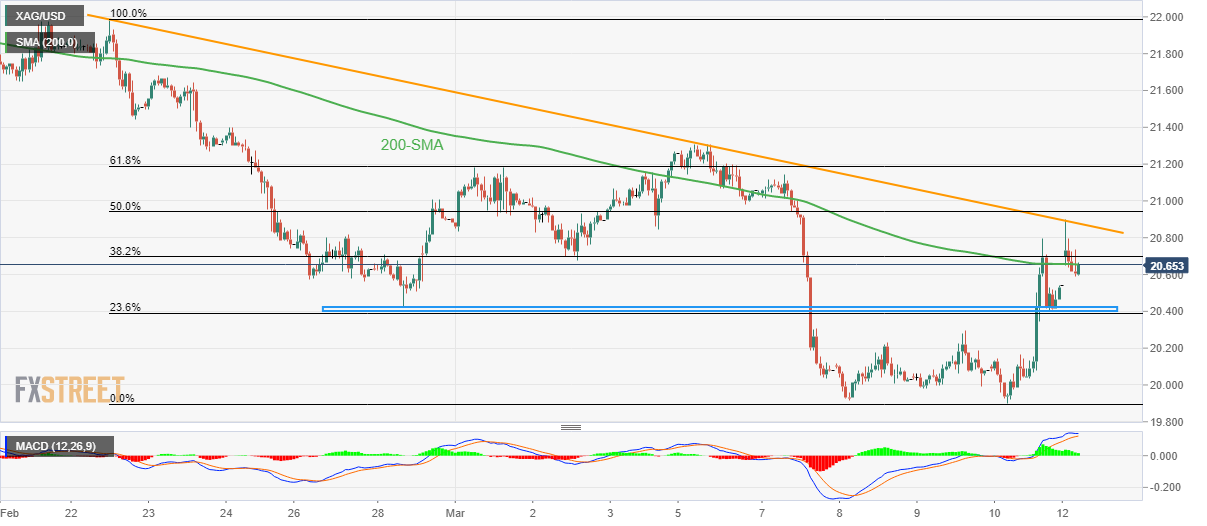
  • Failure to cross short-term resistance line, downside break of 200-SMA lure XAG/USD sellers.
  • Two-week-old horizontal support zone restricts immediate Silver price downside.

Silver price (XAG/USD) clings to mild gains around $20.60 as it probes the metal’s pullback from a short-term key resistance line during early Monday. Even so, the XAG/USD prints the three-day winning streak, as well as extends the previous day’s rebound from the lowest levels since November 04, 2022.

That said, the looming bear cross on the MACD joins the bullion’s inability to stay beyond the 200-SMA, not to forget the failure to cross a two-week-old resistance line, which keeps the Silver price bears hopeful.

As a result, the bullion remains on the way to retesting the two-week-old horizontal support zone, close to $20.40 at the latest. However, the metal’s further downside may witness hardships in breaking the $20.00 psychological magnet.

Following that, the monthly low of $19.95 and the November 2022 bottom surrounding $18.85 will be in focus.

On the contrary, recovery moves remain elusive unless the XAG/USD stays below the downward-sloping resistance line from late February, around $20.90 at the latest. Also acting as an upside filter is the $21.00 round figure.

In a case where the Silver buyers keep control past $21.00, the last week’s high of around $21.30 may act as the last defense of the XAG/USD bears.

Silver price: Hourly chart

Trend: Further downside expected

Additional important levels

Overview
Today last price 20.6
Today Daily Change 0.07
Today Daily Change % 0.34%
Today daily open 20.53
 
Trends
Daily SMA20 21.13
Daily SMA50 22.52
Daily SMA100 22.2
Daily SMA200 20.94
 
Levels
Previous Daily High 20.79
Previous Daily Low 19.9
Previous Weekly High 21.31
Previous Weekly Low 19.9
Previous Monthly High 24.64
Previous Monthly Low 20.42
Daily Fibonacci 38.2% 20.45
Daily Fibonacci 61.8% 20.24
Daily Pivot Point S1 20.02
Daily Pivot Point S2 19.52
Daily Pivot Point S3 19.13
Daily Pivot Point R1 20.91
Daily Pivot Point R2 21.3
Daily Pivot Point R3 21.81


Share: Feed news

Information on these pages contains forward-looking statements that involve risks and uncertainties. Markets and instruments profiled on this page are for informational purposes only and should not in any way come across as a recommendation to buy or sell in these assets. You should do your own thorough research before making any investment decisions. FXStreet does not in any way guarantee that this information is free from mistakes, errors, or material misstatements. It also does not guarantee that this information is of a timely nature. Investing in Open Markets involves a great deal of risk, including the loss of all or a portion of your investment, as well as emotional distress. All risks, losses and costs associated with investing, including total loss of principal, are your responsibility. The views and opinions expressed in this article are those of the authors and do not necessarily reflect the official policy or position of FXStreet nor its advertisers. The author will not be held responsible for information that is found at the end of links posted on this page.

If not otherwise explicitly mentioned in the body of the article, at the time of writing, the author has no position in any stock mentioned in this article and no business relationship with any company mentioned. The author has not received compensation for writing this article, other than from FXStreet.

FXStreet and the author do not provide personalized recommendations. The author makes no representations as to the accuracy, completeness, or suitability of this information. FXStreet and the author will not be liable for any errors, omissions or any losses, injuries or damages arising from this information and its display or use. Errors and omissions excepted.

The author and FXStreet are not registered investment advisors and nothing in this article is intended to be investment advice.

Recommended content


Recommended content

Editors’ Picks

EUR/USD holds below 1.0750 ahead of key US data

EUR/USD holds below 1.0750 ahead of key US data

EUR/USD trades in a tight range below 1.0750 in the European session on Friday. The US Dollar struggles to gather strength ahead of key PCE Price Index data, the Fed's preferred gauge of inflation, and helps the pair hold its ground. 

EUR/USD News

USD/JPY stays firm above 156.00 after BoJ Governor Ueda's comments

USD/JPY stays firm above 156.00 after BoJ Governor Ueda's comments

USD/JPY stays firm above 156.00 after surging above this level on the Bank of Japan's decision to leave the policy settings unchanged. BoJ Governor said weak Yen was not impacting prices but added that they will watch FX developments closely.

USD/JPY News

Gold price oscillates in a range as the focus remains glued to the US PCE Price Index

Gold price oscillates in a range as the focus remains glued to the US PCE Price Index

Gold price struggles to attract any meaningful buyers amid the emergence of fresh USD buying. Bets that the Fed will keep rates higher for longer amid sticky inflation help revive the USD demand.

Gold News

Bitcoin Weekly Forecast: BTC’s next breakout could propel it to $80,000 Premium

Bitcoin Weekly Forecast: BTC’s next breakout could propel it to $80,000

Bitcoin’s recent price consolidation could be nearing its end as technical indicators and on-chain metrics suggest a potential upward breakout. However, this move would not be straightforward and could punish impatient investors. 

Read more

US core PCE inflation set to signal firm price pressures as markets delay Federal Reserve rate cut bets

US core PCE inflation set to signal firm price pressures as markets delay Federal Reserve rate cut bets

The core PCE Price Index, which excludes volatile food and energy prices, is seen as the more influential measure of inflation in terms of Fed positioning. The index is forecast to rise 0.3% on a monthly basis in March, matching February’s increase. 

Read more

Forex MAJORS

Cryptocurrencies

Signatures