|

Silver Price Analysis: XAG/USD renews four-month low as bears attack $20.00

  • Silver price takes offers to refresh multi-day low during three-day downtrend.
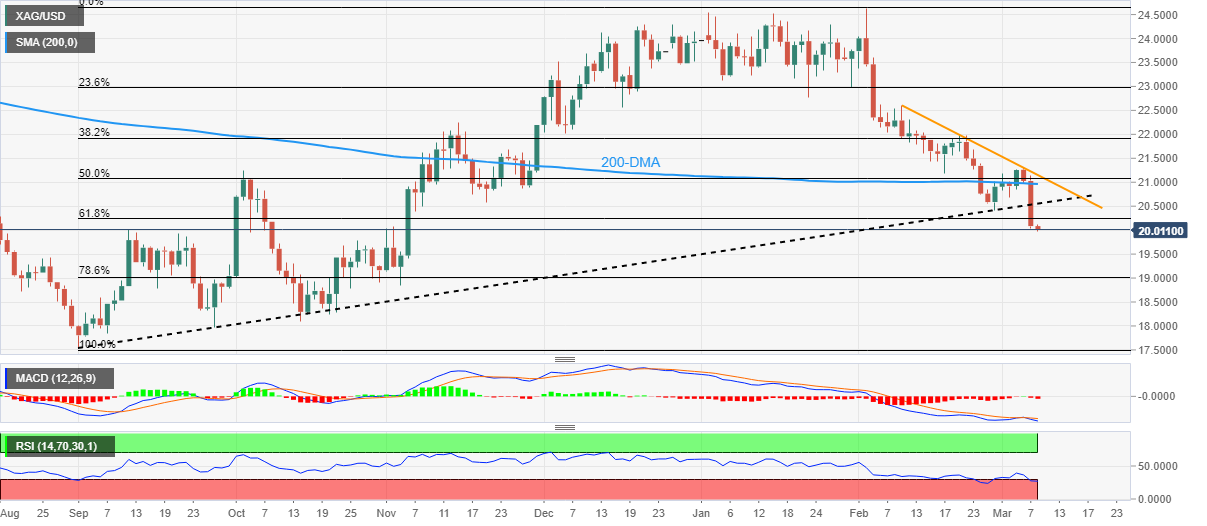
  • Clear break of six-month-old support line, the key Fibonacci retracement level joins bearish MACD signals to favor XAG/USD sellers.
  • 200-DMA, monthly resistance line add to the upside filters.

Silver price (XAG/USD) remains depressed at the lowest levels in four months as sellers poke the $20.00 psychological magnet to refresh the multi-day low during Wednesday’s Asian session.

In doing so, the bright metal extends the previous day’s downside break of a six-month-old ascending support line, as well as the 61.8% Fibonacci retracement level of the metal’s run-up from September 2022 to February 2023. Adding strength to the downside bias are the bearish MACD signals.

It’s worth noting, however, that the RSI (14) is in the oversold territory and hence multiple supports around $19.80 and $19.60 could restrict short-term XAG/USD declines.

Following that, the 78.6% Fibonacci retracement level surrounding the $19.00 round figure could lure the Silver bears before directing them to the lows marked during the last October and September, respectively near $18.10 and $17.55.

Meanwhile, the 61.8% Fibonacci retracement level, also known as the golden Fibonacci ratio, could restrict short-term XAG/USD recovery at around $20.25 before the support-turned-resistance line from September 2022, close to $20.60 by the press time.

In a case where the Silver price remains firmer past $20.60, the 200-DMA and a one-month-old resistance line, around $21.00 and $21.20, may act as the last defenses of the XAG/USD bears.

Silver price: Daily chart

Trend: Further downside expected

Additional important levels

Overview
Today last price20
Today Daily Change-0.08
Today Daily Change %-0.40%
Today daily open20.08
 
Trends
Daily SMA2021.41
Daily SMA5022.73
Daily SMA10022.16
Daily SMA20020.97
 
Levels
Previous Daily High21.14
Previous Daily Low20.03
Previous Weekly High21.27
Previous Weekly Low20.42
Previous Monthly High24.64
Previous Monthly Low20.42
Daily Fibonacci 38.2%20.46
Daily Fibonacci 61.8%20.72
Daily Pivot Point S119.7
Daily Pivot Point S219.31
Daily Pivot Point S318.59
Daily Pivot Point R120.81
Daily Pivot Point R221.53
Daily Pivot Point R321.91

Author

Anil Panchal

Anil Panchal

FXStreet

Anil Panchal has nearly 15 years of experience in tracking financial markets. With a keen interest in macroeconomics, Anil aptly tracks global news/updates and stays well-informed about the global financial moves and their implications.

More from Anil Panchal
Share:

Editor's Picks

EUR/USD holds above 1.1750 after mixed EU PMI data

EUR/USD manages to hold above 1.1750 but struggles to gather recovery momentum on Friday, following the mixed February PMI figures from Germany and the Eurozone. In the second half of the day, Q4 GDP, December inflation and February PMI data from the US will be watched closely by market participants.

GBP/USD recovers further toward 1.3500 after UK PMI data

GBP/USD is recovering ground further toward 1.3500 in European trading on Friday, helped by a modest uptick in the Pound Sterling after stronger-than-expected UK January Retail Sales and February PMI data. However, the pair's further upside could be limited amid persistent US Dollar strength as the focus turns to key US data. 

Gold sticks to positive bias above $5,000 ahead of US data

Gold gains some positive traction for the third consecutive day on Friday. holding above $5,000. Traders now look forward to the key US macro releases – the Advance Q4 GDP report and the Personal Consumption Expenditures (PCE) Price Index – for fresh trading impetus. 

US GDP growth expected to slow down significantly in Q4 after stellar Q3 

The United States Bureau of Economic Analysis will publish the first preliminary estimate of the fourth-quarter Gross Domestic Product at 13:30 GMT. Analysts forecast the US economy to have expanded at a 3% annualized rate, slowing down from the 4.4% growth posted in the previous quarter.

Iran tensions and AI fears at the forefront ahead of key US data

Thursday’s scorecard shows major US Stock benchmarks closed modestly in the red amid mounting US-Iran tensions and AI disruption worries. The S&P 500 shed 19 points (0.3%) to 6,861, the Nasdaq 100 lost 101 points (0.4%) to 24,797, and the Dow Jones Industrial Average dropped 267 points (0.5%) to 49,395.

Official Trump price approaches breakout with mixed signals from traders

Official Trump (TRUMP) is trading at $3.50 at the time of writing, approaching its upper consolidation range. A breakout from this range could open the door for an upside move. On-chain data shows market indecision, with balanced flows between bulls and bears, signaling a lack of clear directional bias.