|

Silver Price Analysis: XAG/USD rebounds from 100-day SMA, not out of the woods yet

  • Silver stages a goodish rebound from over a one-and-half-month low touched on Thursday.
  • The technical setup favours bears and warrants caution before positioning for further gains.
  • A sustained strength beyond the $25.30-40 region is needed to negate the negative outlook.

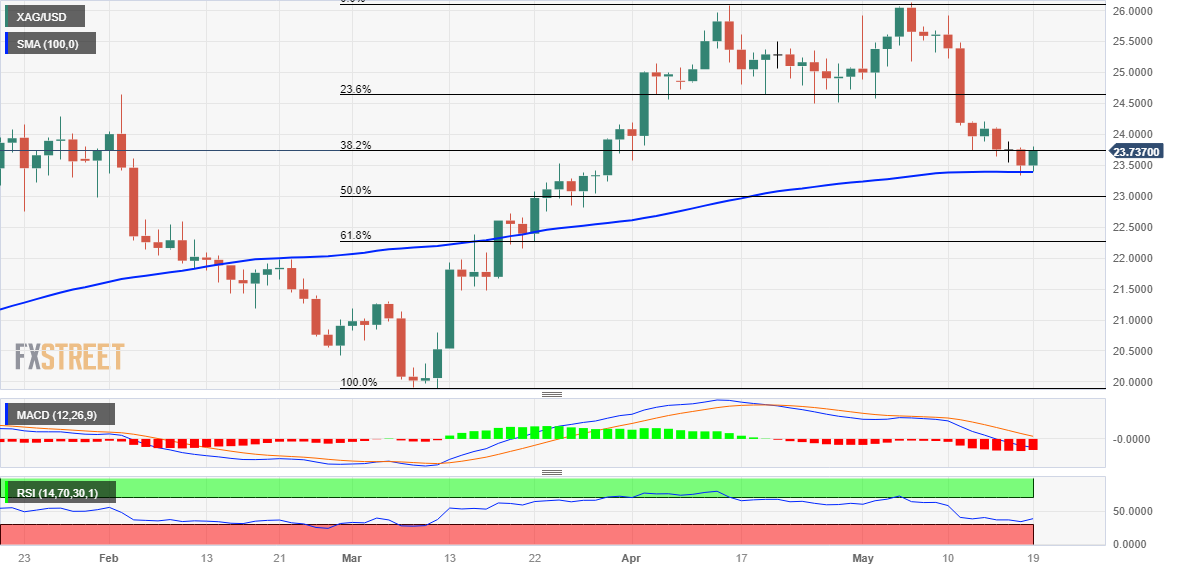
Silver manages to defend the 100-day Simple Moving Average (SMA) and regains positive traction on Friday, reversing a major part of the previous day's slide to the lowest level since March 30. The white metal maintains its bid tone through the early part of the European session and is currently placed around the $23.70-$23.75 region, up over 1% for the day.

The technical setup, however, warrants some caution before positioning for any further appreciating move. Against the backdrop of the recent breakdown through the $24.60-$24.50 horizontal support, which coincided with the 23.6% Fibonacci retracement level of the March-May rally, the overnight slide below the 38.2% Fibo. level favours bearish traders. Moreover, oscillators on the daily chart are holding deep in the negative territory and are still far from being in the oversold zone.

Hence, any subsequent move up is more likely to attract fresh sellers near the $25.00 psychological mark. This, in turn, could cap the XAU/USD near the $25.30-$25.40 supply zone. That said, a sustained strength beyond might trigger a short-covering rally and allow bulls to make a fresh attempt to conquer the $26.00 round-figure mark. The momentum could get extended further towards challenging the YTD peak, around the $26.10-$26.15 region touched earlier this month.

On the flip side, the 100-day SMA, currently pegged near the $23.35 area, now seems to protect the immediate downside, below which the XAG/USD could accelerate the fall towards 50% Fibo. level, around the $23.00 round-figure mark. The downward trajectory could eventually drag the commodity towards the $22.65-$22.60 intermediate support en route to the $22.30-$22.25 region, or the 61.8% Fibo. level.

Silver daily chart

fxsoriginal

Key levels to watch

XAG/USD

Overview
Today last price23.77
Today Daily Change0.27
Today Daily Change %1.15
Today daily open23.5
 
Trends
Daily SMA2024.88
Daily SMA5024.12
Daily SMA10023.39
Daily SMA20021.92
 
Levels
Previous Daily High23.78
Previous Daily Low23.33
Previous Weekly High25.92
Previous Weekly Low23.74
Previous Monthly High26.09
Previous Monthly Low23.57
Daily Fibonacci 38.2%23.5
Daily Fibonacci 61.8%23.61
Daily Pivot Point S123.29
Daily Pivot Point S223.08
Daily Pivot Point S322.84
Daily Pivot Point R123.74
Daily Pivot Point R223.99
Daily Pivot Point R324.2

Author

Haresh Menghani

Haresh Menghani is a detail-oriented professional with 10+ years of extensive experience in analysing the global financial markets.

More from Haresh Menghani
Share:

Markets move fast. We move first.

Orange Juice Newsletter brings you expert driven insights - not headlines. Every day on your inbox.

By subscribing you agree to our Terms and conditions.

Editor's Picks

EUR/USD holds steady near 1.1750 on first trading day of 2026

EUR/USD stays calm on Friday and trades in a narrow channel at around 1.1750 as trading conditions remain thin following the New Year holiday and ahead of the weekend. The economic calendar will not feature any high-impact data releases.

GBP/USD struggles to gain traction, stabilizes above 1.3450

After testing 1.3400 on the last day of 2025, GBP/USD managed to stage a rebound. Nevertheless, the pair finds it difficult to gather momentum and moves sideways above 1.3450 as market participants remain in holiday mood.

Gold climbs toward $4,400 following deep correction

Gold reverses its direction and advances toward $4,400 after suffering heavy losses amid profit-taking before the New Year holiday. Growing expectations for a dovish Fed policy and persistent geopolitical risks seem to be helping XAU/USD stretch higher.

Cardano gains early New Year momentum, bulls target falling wedge breakout

Cardano kicks off the New Year on a positive note and is extending gains, trading above $0.36 at the time of writing on Friday. Improving on-chain and derivatives data point to growing bullish interest, while the technical outlook keeps an upside breakout in focus.

Economic outlook 2026-2027 in advanced countries: Solidity test

After a year marked by global economic resilience and ending on a note of optimism, 2026 looks promising and could be a year of solid economic performance. In our baseline scenario, we expect most of the supportive factors at work in 2025 to continue to play a role in 2026.

Crypto market outlook for 2026

Year 2025 was volatile, as crypto often is.  Among positive catalysts were favourable regulatory changes in the U.S., rise of Digital Asset Treasuries (DAT), adoption of AI and tokenization of Real-World-Assets (RWA).