|

Silver Price Analysis: XAG/USD prints seven-day downtrend as $22.60 lures bears

  • Silver Price remains depressed at the lowest level in two weeks.
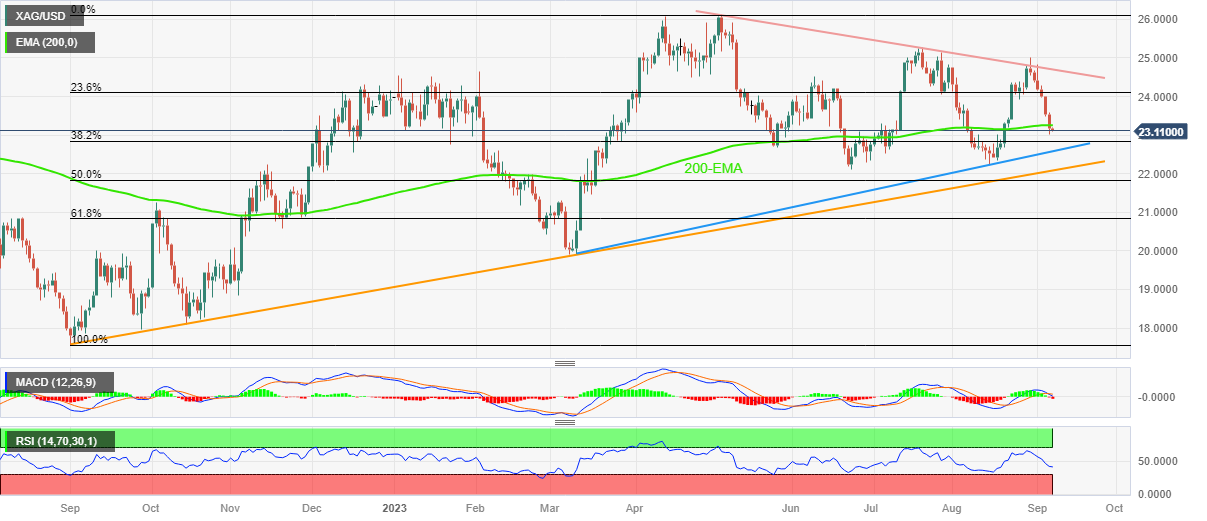
  • Clear downbeat break of 200-EMA, bearish MACD signals direct XAG/USD sellers toward six-month-old rising support line.
  • Multiple hurdles stand tall to challenge Silver Price recovery even as RSI conditions suggest limited downside room.

Silver Price (XAG/USD) dropped for the seventh consecutive day while fading the previous day’s corrective bounce off a two-week low by declining to $23.10 early Thursday morning. In doing so, the bright metal justifies the bearish MACD signals and a clear downside break of the 200-day Exponential Moving Average (EMA).

In addition to the technical signals, the market’s downbeat sentiment and the broadly firmer US Dollar also keep the XAG/USD sellers hopeful.

However, the RSI (14) line is below 50.0 and suggests bottom-picking of the commodity, which in turn highlights an ascending support line from early March, close to $22.60 as the key level to watch for the bears.

It’s worth noting that the precious metal’s failure to rebound from $22.60, will make it vulnerable to test a one-year-long rising trend line, close to $22.10, quickly followed by the $22.00 threshold.

In a case where the Silver Price remains bearish past $22.00, the odds of witnessing a gradual downside toward March’s low of around $19.90 can’t be ruled out. During the likely fall, the 50.0% and 61.8% Fibonacci ratios of September 2022 to May 2023 upside, respectively near $21.85 and $20.80, as well as the $20.00 psychological magnet, can test the XAG/USD sellers.

Alternatively, a daily closing beyond the 200-EMA level of $23.25 isn’t an open invitation to the Silver buyers as multiple levels around $24.00 and $24.20 may test the Silver Price recovery before highlighting the key resistance line stretched from May, close to $24.70 at the latest.

Silver Price: Daily chart
Trend: Limited downside expected

Additional important levels

Overview
Today last price23.12
Today Daily Change-0.06
Today Daily Change %-0.26%
Today daily open23.18
 
Trends
Daily SMA2023.53
Daily SMA5023.73
Daily SMA10023.89
Daily SMA20023.47
 
Levels
Previous Daily High23.6
Previous Daily Low23
Previous Weekly High25.02
Previous Weekly Low24.05
Previous Monthly High25.02
Previous Monthly Low22.23
Daily Fibonacci 38.2%23.23
Daily Fibonacci 61.8%23.37
Daily Pivot Point S122.92
Daily Pivot Point S222.67
Daily Pivot Point S322.33
Daily Pivot Point R123.52
Daily Pivot Point R223.85
Daily Pivot Point R324.11

Author

Anil Panchal

Anil Panchal

FXStreet

Anil Panchal has nearly 15 years of experience in tracking financial markets. With a keen interest in macroeconomics, Anil aptly tracks global news/updates and stays well-informed about the global financial moves and their implications.


More from Anil Panchal
Share:

Editor's Picks

AUD/USD remains below 0.7000 amid light trading

AUD/USD fills a modest bearish gap on Monday, but remains below 0.7000 in the Asian session amid holiday-thinned liquidity. The US Dollar attempts a bounce even as US bond yields pull back from multi-year highs, limiting the pair. Moreover, diminishing odds of another RBA rate hike in November cap the Aussie.

USD/JPY hovers above 158.00 amid Japan/ US holiday

USD/JPY extends its range-bound price action into a new week, trading above 158.00 as bulls remain on high alert amid speculation that authorities will step in to prop up the Japanese Yen. Meanwhile, softer US bond yields keep US Dollar bulls on the back foot and cap the pair's upside. However, geopolitical uncertainties could limit losses for the safe-haven buck amid thin liquidity due to a holiday in Japan and the US.

Gold  remains vulnerable below $4,200 on Fed hike bets

Gold is under mild selling pressure on Monday, trading at around $4,170. The US Dollar advances modestly in thin trading, supported by bets that the Federal Reserve will hike rates at least one more time before year-end.

Bitcoin struggles as ETF outflows, geopolitical uncertainty weigh

Bitcoin hovers around $83,600 on Monday after a 3.1% correction last week. US-listed spot ETFs recorded an outflow of $681.10 million last week, snapping the three-week inflow streak. Geopolitical uncertainty and mixed signals keep investors cautious.

The week ahead: A critical week as earnings and CPI test market

The Oil price is relatively stable this morning, and US and European stock markets are poised to open higher, as risk sentiment shrugs off an escalation in the Middle East and concerns about rising bond yields.

Has Bitcoin really escaped the macro forces it was built to fight?
Over 17 years ago, Satoshi Nakamoto designed Bitcoin (BTC) on the back of a global financial crisis as an alternative to the global monetary system outside the control of central banks, governments and traditional intermediaries. This raises a key question: has Bitcoin really become independent of the macroeconomic forces it was built to challenge?














