Silver Price Analysis: XAG/USD finds support near $26.60 after a sharp correction ahead of US NFP


  • Silver price finds cushion near $26.60 amid correction ahead of US NFP report.
  • The US NFP report will influence market expectations for Fed rate cuts in June.
  • Deepening Middle East tensions keep near-term demand for Silver intact.

Silver price (XAG/USD) discovers support near $26.60 after a pullback from more than two-years high of $27.34. The white metal takes a breather after a strong rally as investors turn cautious ahead of the United States Nonfarm Payrolls (NFP) report for March, which will be published at 12:30 GMT.

According to the expectations, fresh payrolls were 200K, lower than the former reading of 275K. The Unemployment Rate is expected to come out steady at 3.9%.

Investors will also focus on the Average Hourly Earnings data, which will provide fresh inflation outlook. The monthly wage growth is forecasted to have grown at a higher pace of 0.3% from 0.1% in February. In the same period, the annually wage growth is estimated to have dipped to 4.1% against 4.3%.

Strong labor demand and higher wage growth would allow the Federal Reserve (Fed) to delay rate cut plans while signs of labor market conditions easing will boost rate cut hopes for the June meeting. The US Dollar Index (DXY) stabilizes after recovering from two-week low of 103.90 ahead of the US NFP report.

The demand for Silver is bullish in the longer horizon due to deepening Middle East tensions. Air strikes from Israel forces on Iranian embassy in Damascus, situated near Syria’s capital, has deepened fears of Iran’s participation to Israel-Palestine war.

Silver technical analysis

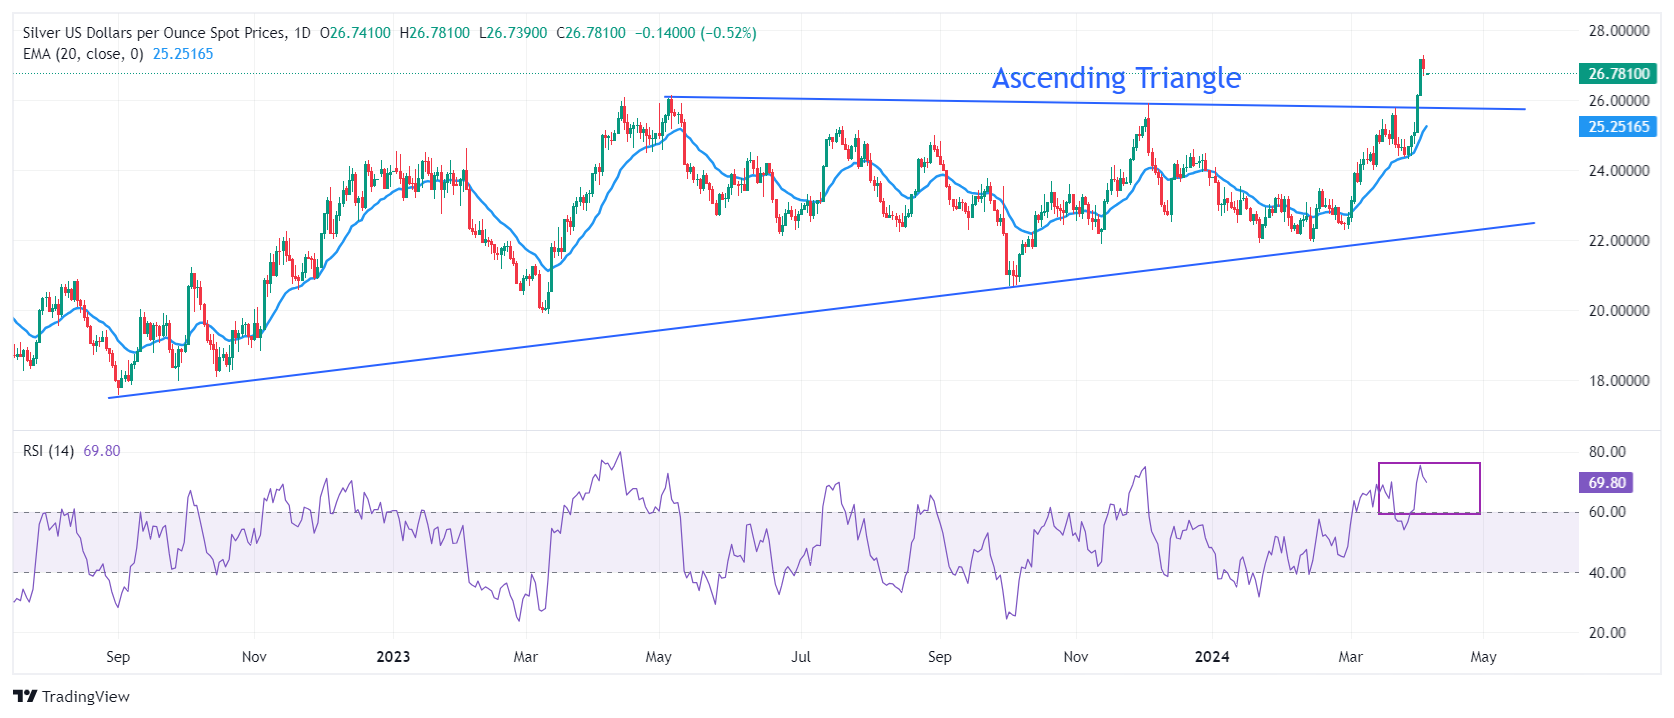
Silver price saw a stalwart rally after a breakout of the Ascending Triangle pattern formed on daily timeframe. The aforementioned chart pattern exhibits sharp volatility contraction but a decisive breakout leads to heavy volume and wider ticks on the upside. The horizontal resistance of the above-mentioned chart pattern, placed from May 5 high at $26.13, has turned into a crucial support for the Silver price bulls.

Advancing 20-day Exponential Moving Average (EMA) near $25.25 keeps the near-term demand unabated.

The 14-period Relative Strength Index (RSI) oscillates in the bullish range of 60.00-80.00, indicating a strong momentum leaned to the upside.

Silver daily chart

XAG/USD

Overview
Today last price 26.76
Today Daily Change -0.16
Today Daily Change % -0.59
Today daily open 26.92
 
Trends
Daily SMA20 25.07
Daily SMA50 23.75
Daily SMA100 23.7
Daily SMA200 23.45
 
Levels
Previous Daily High 27.3
Previous Daily Low 26.68
Previous Weekly High 25
Previous Weekly Low 24.33
Previous Monthly High 25.77
Previous Monthly Low 22.51
Daily Fibonacci 38.2% 26.92
Daily Fibonacci 61.8% 27.06
Daily Pivot Point S1 26.63
Daily Pivot Point S2 26.35
Daily Pivot Point S3 26.01
Daily Pivot Point R1 27.25
Daily Pivot Point R2 27.59
Daily Pivot Point R3 27.87


Share: Feed news

Information on these pages contains forward-looking statements that involve risks and uncertainties. Markets and instruments profiled on this page are for informational purposes only and should not in any way come across as a recommendation to buy or sell in these assets. You should do your own thorough research before making any investment decisions. FXStreet does not in any way guarantee that this information is free from mistakes, errors, or material misstatements. It also does not guarantee that this information is of a timely nature. Investing in Open Markets involves a great deal of risk, including the loss of all or a portion of your investment, as well as emotional distress. All risks, losses and costs associated with investing, including total loss of principal, are your responsibility. The views and opinions expressed in this article are those of the authors and do not necessarily reflect the official policy or position of FXStreet nor its advertisers. The author will not be held responsible for information that is found at the end of links posted on this page.

If not otherwise explicitly mentioned in the body of the article, at the time of writing, the author has no position in any stock mentioned in this article and no business relationship with any company mentioned. The author has not received compensation for writing this article, other than from FXStreet.

FXStreet and the author do not provide personalized recommendations. The author makes no representations as to the accuracy, completeness, or suitability of this information. FXStreet and the author will not be liable for any errors, omissions or any losses, injuries or damages arising from this information and its display or use. Errors and omissions excepted.

The author and FXStreet are not registered investment advisors and nothing in this article is intended to be investment advice.

Recommended content


Recommended content

Editors’ Picks

EUR/USD clings to gains above 1.1500

EUR/USD clings to gains above 1.1500

Following the U-turn in the US Dollar, EUR/USD rose to the 1.1550 region on Monday, where a decent resistance seems to have emerged so far. In the meantime, the Greenback continues to suffer the dovish message from FOMC’s Bowman, while geopolitical concerns continue to limit the downside.

Could Iran block the Strait of Hormuz? Why Oil is on edge after US strikes

Could Iran block the Strait of Hormuz? Why Oil is on edge after US strikes

As the Israel-Iran conflict reaches new heights, an old threat is coming back to haunt the markets: that of the closure of the Strait of Hormuz. This narrow arm of the sea in the Persian Gulf, wedged between Iran to the north and the United Arab Emirates and Oman to the south, is much more than a simple sea passage.

Gold trades near $3,400 on geopolitical fears

Gold trades near $3,400 on geopolitical fears

Gold maintains its bullish bias on Monday, trading at shouting distance from the key $3,400 mark per troy ounce on the back of increasing geopolitical tensions after Iran announced a missile attack to the US military base in the UAE.

AI Tokens Price Prediction: Story, Virtuals Protocol rebound following sell-off after US strikes on Iran

AI Tokens Price Prediction: Story, Virtuals Protocol rebound following sell-off after US strikes on Iran

Geopolitical tensions in the Middle East caused a liquidation havoc of over $1 billion in the cryptocurrency market over the weekend, following US President Donald Trump’s direct involvement in the conflict between Israel and Iran.

GBP/USD climbs to daily highs around 1.3480

GBP/USD climbs to daily highs around 1.3480

After bottoming out in multi-week lows near 1.3370, GBP/USD now picks up pace and gains around a cent to hit new daily peaks around 1.3480 in response to fresh selling pressure hitting the Greenback. The knee-jerk in the US Dollar comes despite steady fears on the Iran-Israel-US front and firm results from preliminary US PMIs for the month of June. On the UK docket, all the attention remains on upcoming flash Manufacturing and Services PMIs.

The Best brokers to trade EUR/USD

The Best brokers to trade EUR/USD

SPONSORED Discover the top brokers for trading EUR/USD in 2025. Our list features brokers with competitive spreads, fast execution, and powerful platforms. Whether you're a beginner or an expert, find the right partner to navigate the dynamic Forex market.

Forex MAJORS

Cryptocurrencies

Signatures

Best Brokers of 2025