Silver Price Analysis: XAG/USD edges above $29.00 as double bottom looms
- Silver rallies over 1% from a daily low of $28.95.
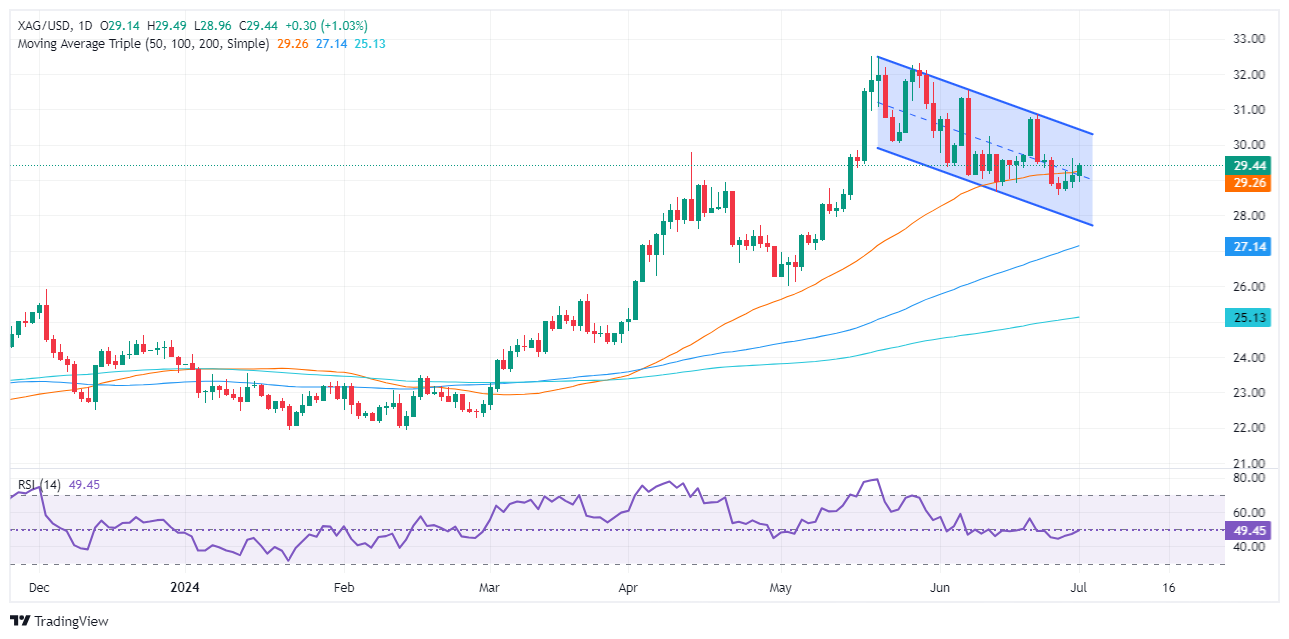
- Technicals suggest upward bias; potential 'double bottom' pattern forming.
- Resistance levels: $30.00 (trendline), $30.84 ('double bottom' neckline), $32.29 (May 29 high), $32.51 (YTD high).
- Support points: $29.00, $28.57 (June 26 low), $27.59 (April 15 low).

Silver recovered on Monday, registering a gain of more than 1% courtesy of broad US Dollar weakness even though US Treasury bond yields climbed. Economic data from the United States (US) was mixed, while US equities fluctuated between gainers and losers. The XAG/USD trades at $29.44 after hitting a daily low of $28.95.
XAG/USD Price Analysis: Technical outlook
From a daily chart standpoint, the grey metal is upward biased and still trading within the boundaries of a descending channel. Traders remain cautious, as shown by the Relative Strength Index (RSI), which is wavering around the 50-neutral line and indicates that neither buyers nor sellers are gathering momentum.
However, price action shows a formation of a ‘double bottom,’ though XAG/USD might clear key resistance levels, to confirm its validity.
Silver buyers need to clear the downslope trendline drawn from May highs, which is around $30.00. Once done, the ‘double bottom neckline’ will emerge at $30.84, the June 21 high. If cleared, this would confirm the bullish chart pattern. On further strength, XAG/USD could test the May 29 high of $32.29, ahead of the year-to-date (YTD) high of $32.51.
On the flip side, if XAG/USD falls below $29.00, the next support would be the June 26 low of $28.57. Once cleared, the next stop would be the April 15 swing low of $ 27.59.
XAG/USD Price Action – Daily Chart
Fed FAQs
Monetary policy in the US is shaped by the Federal Reserve (Fed). The Fed has two mandates: to achieve price stability and foster full employment. Its primary tool to achieve these goals is by adjusting interest rates. When prices are rising too quickly and inflation is above the Fed’s 2% target, it raises interest rates, increasing borrowing costs throughout the economy. This results in a stronger US Dollar (USD) as it makes the US a more attractive place for international investors to park their money. When inflation falls below 2% or the Unemployment Rate is too high, the Fed may lower interest rates to encourage borrowing, which weighs on the Greenback.
The Federal Reserve (Fed) holds eight policy meetings a year, where the Federal Open Market Committee (FOMC) assesses economic conditions and makes monetary policy decisions. The FOMC is attended by twelve Fed officials – the seven members of the Board of Governors, the president of the Federal Reserve Bank of New York, and four of the remaining eleven regional Reserve Bank presidents, who serve one-year terms on a rotating basis.
In extreme situations, the Federal Reserve may resort to a policy named Quantitative Easing (QE). QE is the process by which the Fed substantially increases the flow of credit in a stuck financial system. It is a non-standard policy measure used during crises or when inflation is extremely low. It was the Fed’s weapon of choice during the Great Financial Crisis in 2008. It involves the Fed printing more Dollars and using them to buy high grade bonds from financial institutions. QE usually weakens the US Dollar.
Quantitative tightening (QT) is the reverse process of QE, whereby the Federal Reserve stops buying bonds from financial institutions and does not reinvest the principal from the bonds it holds maturing, to purchase new bonds. It is usually positive for the value of the US Dollar.
Author

Christian Borjon Valencia
FXStreet
Markets analyst, news editor, and trading instructor with over 14 years of experience across FX, commodities, US equity indices, and global macro markets.


