Silver Price Analysis: XAG/USD bulls appear well set to prod $24.50 hurdle


  • Silver Price remains firmer at monthly high after crossing the 200-SMA.
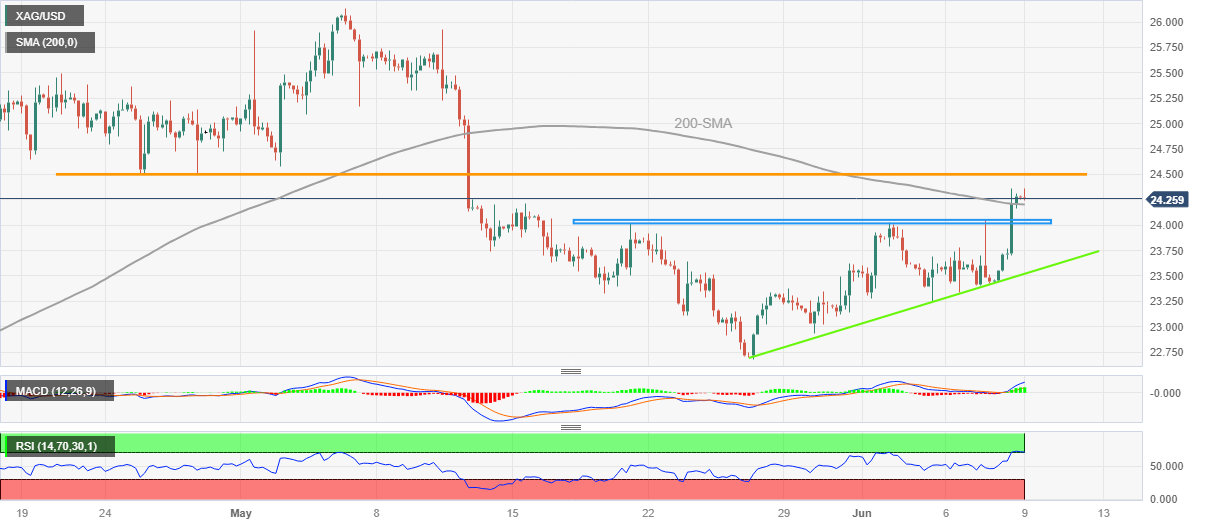
  • Upside break of previous key resistance area, bullish MACD signals suggest further advances of XAG/USD.
  • Overbought RSI hints at limited upside room and highlights lows marked during late April as immediate resistance.

Silver Price (XAG/USD) grinds near the highest level in a month, making rounds to $24.30 early Friday morning. In doing so, the bright metal cheers upside break of the 200-SMA amid a bullish MACD signal.

Adding strength to the upside bias is the XAG/USD run-up beyond the previously important resistance zone of around $24.00-24.05.

However, the nearly overbought RSI conditions challenge the Silver buyers as they approach a horizontal hurdle comprising lows marked during late April, around $24.50. Also acting as an upside filter is the May 02 bottom surrounding $24.60.

Following that, a run-up towards $26.00 and the previous monthly high of around $26.15 can’t be ruled out.

On the flip side, a break of the 200-SMA level of $24.20 could quickly recall the XAG/USD sellers targeting the $24.05-24.00 resistance-turned-support.

In a case where the Silver Price remains bearish past $24.00, a fortnight-old ascending trend line near $23.50 can act as the last defense of the XAG/USD buyers.

Overall, the Silver Price is likely to remain firmer but the upside room appears limited as the US Dollar bears take a breather.

Also read: US Dollar Index: DXY suffers from downbeat US data, pre-Fed positioning at 13-day low near 103.30

Silver Price: Four-hour chart

Trend: Limited upside expected

Additional important levels

Overview
Today last price 24.34
Today Daily Change 0.07
Today Daily Change % 0.29%
Today daily open 24.27
 
Trends
Daily SMA20 23.57
Daily SMA50 24.49
Daily SMA100 23.35
Daily SMA200 22.23
 
Levels
Previous Daily High 24.36
Previous Daily Low 23.43
Previous Weekly High 24.02
Previous Weekly Low 22.93
Previous Monthly High 26.14
Previous Monthly Low 22.68
Daily Fibonacci 38.2% 24
Daily Fibonacci 61.8% 23.79
Daily Pivot Point S1 23.68
Daily Pivot Point S2 23.09
Daily Pivot Point S3 22.76
Daily Pivot Point R1 24.61
Daily Pivot Point R2 24.94
Daily Pivot Point R3 25.53


Share: Feed news

Information on these pages contains forward-looking statements that involve risks and uncertainties. Markets and instruments profiled on this page are for informational purposes only and should not in any way come across as a recommendation to buy or sell in these assets. You should do your own thorough research before making any investment decisions. FXStreet does not in any way guarantee that this information is free from mistakes, errors, or material misstatements. It also does not guarantee that this information is of a timely nature. Investing in Open Markets involves a great deal of risk, including the loss of all or a portion of your investment, as well as emotional distress. All risks, losses and costs associated with investing, including total loss of principal, are your responsibility. The views and opinions expressed in this article are those of the authors and do not necessarily reflect the official policy or position of FXStreet nor its advertisers. The author will not be held responsible for information that is found at the end of links posted on this page.

If not otherwise explicitly mentioned in the body of the article, at the time of writing, the author has no position in any stock mentioned in this article and no business relationship with any company mentioned. The author has not received compensation for writing this article, other than from FXStreet.

FXStreet and the author do not provide personalized recommendations. The author makes no representations as to the accuracy, completeness, or suitability of this information. FXStreet and the author will not be liable for any errors, omissions or any losses, injuries or damages arising from this information and its display or use. Errors and omissions excepted.

The author and FXStreet are not registered investment advisors and nothing in this article is intended to be investment advice.

Recommended content


Recommended content

Editors’ Picks

EUR/USD edges lower toward 1.0700 post-US PCE

EUR/USD edges lower toward 1.0700 post-US PCE

EUR/USD stays under modest bearish pressure but manages to hold above 1.0700 in the American session on Friday. The US Dollar (USD) gathers strength against its rivals after the stronger-than-forecast PCE inflation data, not allowing the pair to gain traction.

EUR/USD News

GBP/USD retreats to 1.2500 on renewed USD strength

GBP/USD retreats to 1.2500 on renewed USD strength

GBP/USD lost its traction and turned negative on the day near 1.2500. Following the stronger-than-expected PCE inflation readings from the US, the USD stays resilient and makes it difficult for the pair to gather recovery momentum.

GBP/USD News

Gold struggles to hold above $2,350 following US inflation

Gold struggles to hold above $2,350 following US inflation

Gold turned south and declined toward $2,340, erasing a large portion of its daily gains, as the USD benefited from PCE inflation data. The benchmark 10-year US yield, however, stays in negative territory and helps XAU/USD limit its losses. 

Gold News

Bitcoin Weekly Forecast: BTC’s next breakout could propel it to $80,000 Premium

Bitcoin Weekly Forecast: BTC’s next breakout could propel it to $80,000

Bitcoin’s recent price consolidation could be nearing its end as technical indicators and on-chain metrics suggest a potential upward breakout. However, this move would not be straightforward and could punish impatient investors. 

Read more

Week ahead – Hawkish risk as Fed and NFP on tap, Eurozone data eyed too

Week ahead – Hawkish risk as Fed and NFP on tap, Eurozone data eyed too

Fed meets on Wednesday as US inflation stays elevated. Will Friday’s jobs report bring relief or more angst for the markets? Eurozone flash GDP and CPI numbers in focus for the Euro.

Read more

Forex MAJORS

Cryptocurrencies

Signatures